More actions
Dashboards
A dashboard is an overview over a number of different but mostly related information in one interface. A dashboard will typically consist of a number of dashboard items, which may be diagrams, tables, texts, images and action elements (radio buttons, check boxes, drop downs, lists). Furthermore, the dashboard provides interactivity of different kinds; clicking, selecting and other interactions with one the dashboard items can be configured to affect the content of the other items.
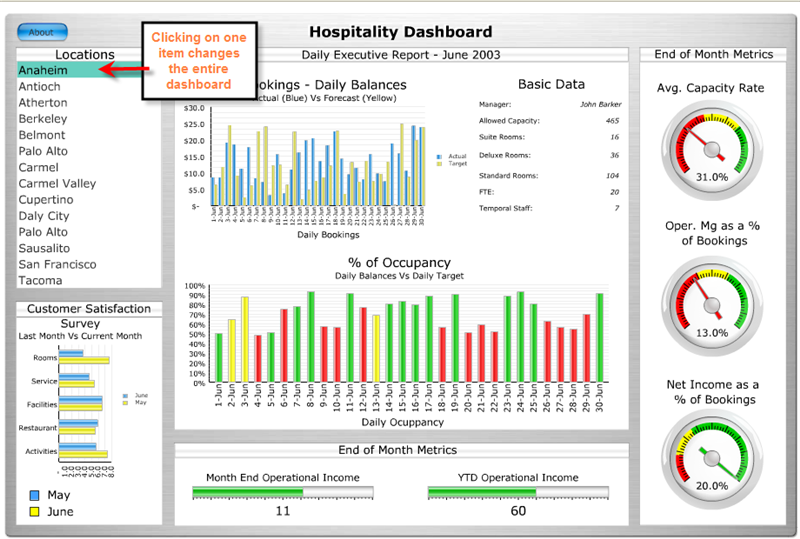
A typical dashboard example is shown below.
In the above example we see a lot of charts and one element that, when clicked, will update all the charts at once. If the user changes from "Anaheim" to "Antioch" then all charts will change results to reflect the results from this location only.
In catglobe we build up such a dashboard by creating each element of the dashboard as individual items and then placing them inside a common page with specified interactivity between the elements. The common page is created in a simple HTML editor. This gives us a lot of flexibility, since we can then make the dashboard conform with different screen sizes and utilize HTML features like image, background, and links to external pages.
Dashboards is currently meant to be used as a page on a Monitor site. To read more on how to add Dashboards and other items to Monitors, please click here.
Below you can read more on using the dashboard editor as well as the creation of different types of elements to be used in the dashboard.
Subcategories
This category has only the following subcategory.
L
Pages in category "Dashboards"
This category contains only the following page.

