More actions
No edit summary |
No edit summary |
||
| (One intermediate revision by one other user not shown) | |||
| Line 1: | Line 1: | ||
{{HelpFiles_Report_Module}} | |||
| |||
== Setting up free labels == | |||
Setting up free labels works the same way in both the common properties dialog as in the tracking and campaign diagrams. Please notice that the location of free labels in your diagrams depend on your style sheet! | Setting up free labels works the same way in both the common properties dialog as in the tracking and campaign diagrams. Please notice that the location of free labels in your diagrams depend on your style sheet! | ||
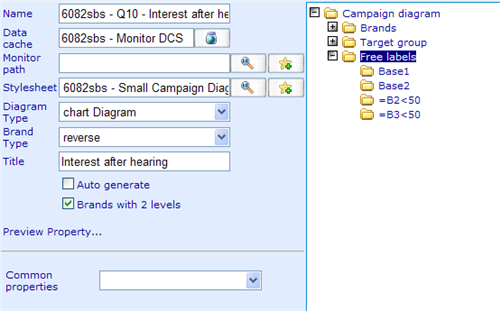
When highlighting the free label folder there is one possible setting: | When highlighting the free label folder there is one possible setting: | ||
[[Image:2866.png|500px|Dynamic diagram - free label folder]] | [[Image:2866.png|500px|Dynamic diagram - free label folder]] | ||
'''Common properties:''' Decides whether the target groups for the diagram will be inherited from a common property. If you set up both common properties and also set the diagram to have its own target groups, a combination of both will be shown in the control! | '''Common properties:''' Decides whether the target groups for the diagram will be inherited from a common property. If you set up both common properties and also set the diagram to have its own target groups, a combination of both will be shown in the control! | ||
==[[Image:5588.png|800px|FreeLabel5-5-1]]== | == [[Image:5588.png|800px|FreeLabel5-5-1]] == | ||
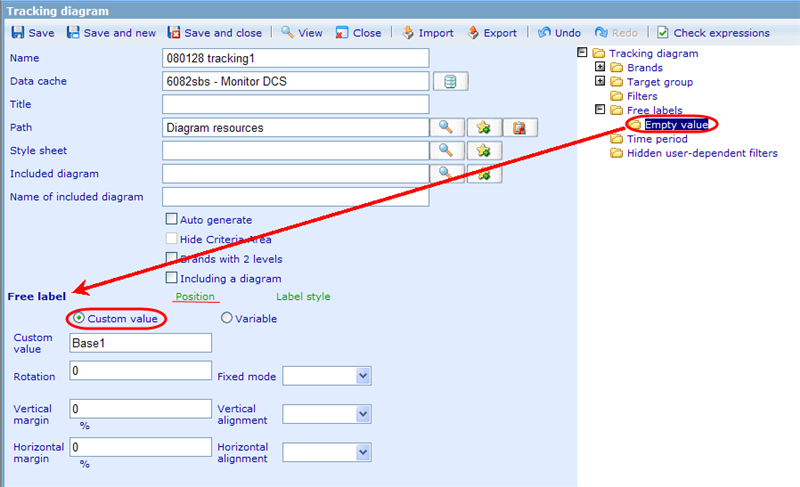
There are three types of free labels that we can add to a diagram; custom values and variable values. | There are three types of free labels that we can add to a diagram; custom values and variable values. | ||
'''Custom values''' are texts that we just place inside the diagram. They will not have any data inside them. | '''Custom values''' are texts that we just place inside the diagram. They will not have any data inside them. | ||
'''Variable values''' are values that are system calculated (like base, average, etc.) that can be placed inside the diagram to show other values than just the diagram values. An example would be to show the average number of respondents that joined a tracking diagram over weeks. | '''Variable values''' are values that are system calculated (like base, average, etc.) that can be placed inside the diagram to show other values than just the diagram values. An example would be to show the average number of respondents that joined a tracking diagram over weeks. | ||
For both types of free labels we can choose between two setting areas: position and label style. | For both types of free labels we can choose between two setting areas: position and label style. | ||
'''Position''' decides where the label will be placed on the diagram. under fixed mode you can choose some standard places (top, bottom, left, right) or you can customize the location using the fields vertical margin, horizontal margin, vertical alignment and horizontal alignment. | '''Position''' decides where the label will be placed on the diagram. under fixed mode you can choose some standard places (top, bottom, left, right) or you can customize the location using the fields vertical margin, horizontal margin, vertical alignment and horizontal alignment. | ||
'''Label style''' decides the font type, font size and font color of the inserted free label, as well as the background graphics of the label (called backplane). | '''Label style''' decides the font type, font size and font color of the inserted free label, as well as the background graphics of the label (called backplane). | ||
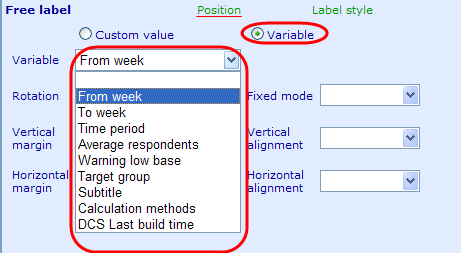
Now let us look at the different types of variable free labels that we have available. | Now let us look at the different types of variable free labels that we have available. | ||
[[Image:5589.png|461px|Freelabel5-5-2]] | [[Image:5589.png|461px|Freelabel5-5-2]] | ||
'''Base1 (Available for Campaign diagrams):''' Specifies how many respondents answered the first analyzed campaign (brand). The base is dependent on filters chosen in controls in the viewer. | '''Base1 (Available for Campaign diagrams):''' Specifies how many respondents answered the first analyzed campaign (brand). The base is dependent on filters chosen in controls in the viewer. | ||
'''Base2 (Available for Campaign diagrams):''' Specifies how many respondents answered the second analyzed campaign (brand). The base is dependent on filters chosen in controls in the viewer. | '''Base2 (Available for Campaign diagrams):''' Specifies how many respondents answered the second analyzed campaign (brand). The base is dependent on filters chosen in controls in the viewer. | ||
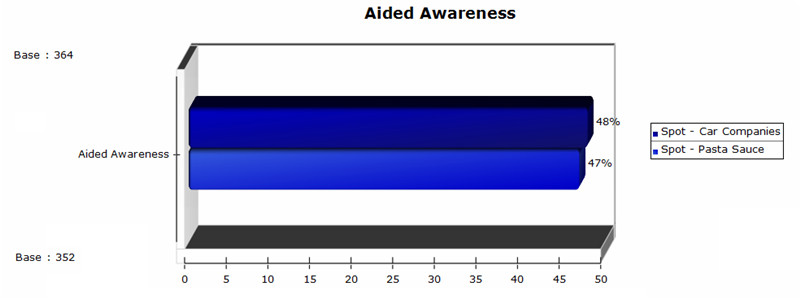
Please look below to see a typical example of bases used in free labels of campaign diagrams: | Please look below to see a typical example of bases used in free labels of campaign diagrams: | ||
[[Image:2868.png|800px|Dynamic diagram base example]] | [[Image:2868.png|800px|Dynamic diagram base example]] | ||
As can be seen above, the first campaign 'Spot - Car Companies' is based on a total of 364 people answering the aided awareness question. The second campaign is based on a total of 352 respondents answers to the question. | As can be seen above, the first campaign 'Spot - Car Companies' is based on a total of 364 people answering the aided awareness question. The second campaign is based on a total of 352 respondents answers to the question. | ||
'''DiagnosticPeriod1 (Available for Campaign diagrams):''' Specifies the period in which the first chosen campaign (brand) is carried out. The shown dates will depend on the start and end week/year specified for the campaign in the brand setup. | '''DiagnosticPeriod1 (Available for Campaign diagrams):''' Specifies the period in which the first chosen campaign (brand) is carried out. The shown dates will depend on the start and end week/year specified for the campaign in the brand setup. | ||
'''DiagnosticPeriod2 (Available for Campaign diagrams):''' Specifies the period in which the second chosen campaign (brand) is carried out. The shown dates will depend on the start and end week/year specified for the campaign in the brand setup. | '''DiagnosticPeriod2 (Available for Campaign diagrams):''' Specifies the period in which the second chosen campaign (brand) is carried out. The shown dates will depend on the start and end week/year specified for the campaign in the brand setup. | ||
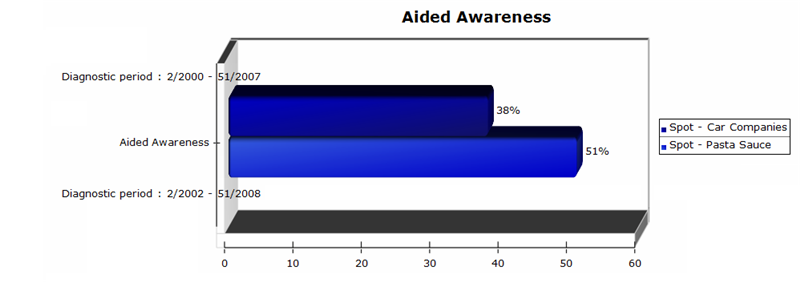
Please look below to see a typical example of diagnostic period free labels used in campaign diagrams: | Please look below to see a typical example of diagnostic period free labels used in campaign diagrams: | ||
[[Image:2869.png|800px|Diagnostic period example]] | [[Image:2869.png|800px|Diagnostic period example]] | ||
'''Mean1 (Available for Campaign diagrams): '''Supplies the 'mean' value for those answering the first analyzed campaign under the specified filters. | '''Mean1 (Available for Campaign diagrams): '''Supplies the 'mean' value for those answering the first analyzed campaign under the specified filters. | ||
'''Mean2 (Available for Campaign diagrams): '''Supplies the 'mean' value for those answering the second analyzed campaign under the specified filters. | '''Mean2 (Available for Campaign diagrams): '''Supplies the 'mean' value for those answering the second analyzed campaign under the specified filters. | ||
'''Target Group 1 (Available for Campaign diagrams):''' Shows all the target groups used in calculating the first analyzed campaign as text in the diagram. | '''Target Group 1 (Available for Campaign diagrams):''' Shows all the target groups used in calculating the first analyzed campaign as text in the diagram. | ||
'''Target Group 2 (Available for Campaign diagrams):''' Shows all the target groups used in calculating the second analyzed campaign as text in the diagram. | '''Target Group 2 (Available for Campaign diagrams):''' Shows all the target groups used in calculating the second analyzed campaign as text in the diagram. | ||
'''Legend 1 (Available for Campaign diagrams):''' Specifies where the legend for the name of the first analyzed campaign will be placed. | '''Legend 1 (Available for Campaign diagrams):''' Specifies where the legend for the name of the first analyzed campaign will be placed. | ||
'''Legend 2 (Available for Campaign diagrams): '''Specifies where the legend for the name of the second analyzed campaign will be placed. | '''Legend 2 (Available for Campaign diagrams): '''Specifies where the legend for the name of the second analyzed campaign will be placed. | ||
'''FromWeek (Available for Tracking diagrams):''' Will display start week and year of the diagram according to values chosen in filter area in the following format '22/2007' | '''FromWeek (Available for Tracking diagrams):''' Will display start week and year of the diagram according to values chosen in filter area in the following format '22/2007' | ||
'''ToWeek (Available for Tracking diagrams):''' Will display end week and year of the diagram according to values chosen in filter area in the following format '25/2007' | '''ToWeek (Available for Tracking diagrams):''' Will display end week and year of the diagram according to values chosen in filter area in the following format '25/2007' | ||
'''TimePeriod (Available for Tracking diagrams): '''Will display both start and end week and year of the diagram according to values chosen in filter area in the following format 'Time period: Week 22/2007 - 25/2007 ' | '''TimePeriod (Available for Tracking diagrams): '''Will display both start and end week and year of the diagram according to values chosen in filter area in the following format 'Time period: Week 22/2007 - 25/2007 ' | ||
'''CalculationMethod (Available for Tracking diagrams): '''Will display rolling average calculation method of the diagram according to values chosen in filter area in the following format 'Calculation method: 2 weeks' | '''CalculationMethod (Available for Tracking diagrams): '''Will display rolling average calculation method of the diagram according to values chosen in filter area in the following format 'Calculation method: 2 weeks' | ||
'''AverageRespondents (Available for Tracking diagrams):''' Will display the number of people answering for each week item of the diagram according to values chosen in filter area in the following format 'Average no. of respondents per data point: 233'. | '''AverageRespondents (Available for Tracking diagrams):''' Will display the number of people answering for each week item of the diagram according to values chosen in filter area in the following format 'Average no. of respondents per data point: 233'. | ||
'''TargetGroup (Available for Tracking diagrams): '''Works the same way that target group free labels for campaigns work. Shows all the target groups chosen as a text string free label! | '''TargetGroup (Available for Tracking diagrams): '''Works the same way that target group free labels for campaigns work. Shows all the target groups chosen as a text string free label! | ||
'''Subtitle (Available for Tracking diagrams):''' Will show the list of 'brands' that user chose as a text in a free label. | '''Subtitle (Available for Tracking diagrams):''' Will show the list of 'brands' that user chose as a text in a free label. | ||
'''DCS Last Build Time (Available for Tracking and Campaign diagrams):''' Will show the date when the data cache used for the dynamic diagram was last rebuild. | '''DCS Last Build Time (Available for Tracking and Campaign diagrams):''' Will show the date when the data cache used for the dynamic diagram was last rebuild. | ||
'''Warning Low Base (Available for Tracking diagrams):''' Will warn the user when there are too few people that joined the tracking diagram with the specified filters. With this choice it is possible to specify an appropriate text to show in the diagram. | '''Warning Low Base (Available for Tracking diagrams):''' Will warn the user when there are too few people that joined the tracking diagram with the specified filters. With this choice it is possible to specify an appropriate text to show in the diagram. __NOTOC__ <!-- imported from file: 5587.htm--> | ||
__NOTOC__ | |||
<!-- imported from file: 5587.htm--> | [[Category:Campaign_diagram]] | ||
Latest revision as of 08:27, 20 January 2012
Setting up free labels
Setting up free labels works the same way in both the common properties dialog as in the tracking and campaign diagrams. Please notice that the location of free labels in your diagrams depend on your style sheet!
When highlighting the free label folder there is one possible setting:
Common properties: Decides whether the target groups for the diagram will be inherited from a common property. If you set up both common properties and also set the diagram to have its own target groups, a combination of both will be shown in the control!
There are three types of free labels that we can add to a diagram; custom values and variable values.
Custom values are texts that we just place inside the diagram. They will not have any data inside them.
Variable values are values that are system calculated (like base, average, etc.) that can be placed inside the diagram to show other values than just the diagram values. An example would be to show the average number of respondents that joined a tracking diagram over weeks.
For both types of free labels we can choose between two setting areas: position and label style.
Position decides where the label will be placed on the diagram. under fixed mode you can choose some standard places (top, bottom, left, right) or you can customize the location using the fields vertical margin, horizontal margin, vertical alignment and horizontal alignment.
Label style decides the font type, font size and font color of the inserted free label, as well as the background graphics of the label (called backplane).
Now let us look at the different types of variable free labels that we have available.
Base1 (Available for Campaign diagrams): Specifies how many respondents answered the first analyzed campaign (brand). The base is dependent on filters chosen in controls in the viewer.
Base2 (Available for Campaign diagrams): Specifies how many respondents answered the second analyzed campaign (brand). The base is dependent on filters chosen in controls in the viewer.
Please look below to see a typical example of bases used in free labels of campaign diagrams:
As can be seen above, the first campaign 'Spot - Car Companies' is based on a total of 364 people answering the aided awareness question. The second campaign is based on a total of 352 respondents answers to the question.
DiagnosticPeriod1 (Available for Campaign diagrams): Specifies the period in which the first chosen campaign (brand) is carried out. The shown dates will depend on the start and end week/year specified for the campaign in the brand setup.
DiagnosticPeriod2 (Available for Campaign diagrams): Specifies the period in which the second chosen campaign (brand) is carried out. The shown dates will depend on the start and end week/year specified for the campaign in the brand setup.
Please look below to see a typical example of diagnostic period free labels used in campaign diagrams:
Mean1 (Available for Campaign diagrams): Supplies the 'mean' value for those answering the first analyzed campaign under the specified filters.
Mean2 (Available for Campaign diagrams): Supplies the 'mean' value for those answering the second analyzed campaign under the specified filters.
Target Group 1 (Available for Campaign diagrams): Shows all the target groups used in calculating the first analyzed campaign as text in the diagram.
Target Group 2 (Available for Campaign diagrams): Shows all the target groups used in calculating the second analyzed campaign as text in the diagram.
Legend 1 (Available for Campaign diagrams): Specifies where the legend for the name of the first analyzed campaign will be placed.
Legend 2 (Available for Campaign diagrams): Specifies where the legend for the name of the second analyzed campaign will be placed.
FromWeek (Available for Tracking diagrams): Will display start week and year of the diagram according to values chosen in filter area in the following format '22/2007'
ToWeek (Available for Tracking diagrams): Will display end week and year of the diagram according to values chosen in filter area in the following format '25/2007'
TimePeriod (Available for Tracking diagrams): Will display both start and end week and year of the diagram according to values chosen in filter area in the following format 'Time period: Week 22/2007 - 25/2007 '
CalculationMethod (Available for Tracking diagrams): Will display rolling average calculation method of the diagram according to values chosen in filter area in the following format 'Calculation method: 2 weeks'
AverageRespondents (Available for Tracking diagrams): Will display the number of people answering for each week item of the diagram according to values chosen in filter area in the following format 'Average no. of respondents per data point: 233'.
TargetGroup (Available for Tracking diagrams): Works the same way that target group free labels for campaigns work. Shows all the target groups chosen as a text string free label!
Subtitle (Available for Tracking diagrams): Will show the list of 'brands' that user chose as a text in a free label.
DCS Last Build Time (Available for Tracking and Campaign diagrams): Will show the date when the data cache used for the dynamic diagram was last rebuild.
Warning Low Base (Available for Tracking diagrams): Will warn the user when there are too few people that joined the tracking diagram with the specified filters. With this choice it is possible to specify an appropriate text to show in the diagram.

