More actions
jrfconvert import |
No edit summary |
||
| (2 intermediate revisions by 2 users not shown) | |||
| Line 1: | Line 1: | ||
[[Category: | [[Category:Custom Y gridlines]] | ||
| {{HelpFiles_Report_Module}} | ||
==Change the style of a custom Y gridline== | |||
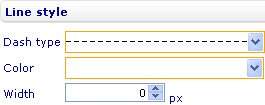
[[Image:6685.jpg|265px|(Custom Y gridlines - change the style) Style sheet - Axes - Custom Y gridlines - Line - Line style]] | [[Image:6685.jpg|265px|(Custom Y gridlines - change the style) Style sheet - Axes - Custom Y gridlines - Line - Line style]] | ||
Latest revision as of 04:58, 19 January 2012
Change the style of a custom Y gridline
To change the style of a custom Y gridline in a bar line, area, point, bubble, or box and whiskers chart through the External Style Sheet editor (if the gridline is added to the external style sheet of the chart) or the Inline Style Sheet editor (if the gridline is added to the inline style sheet of the chart):
- Under Axes, select Custom Y gridlines.
- On the right-hand area, select the custom Y gridline you want from the Line list, and then find the Line style group of settings on the right side of the area.
- Change the line type of the gridline by selecting an option from the Line type drop-down list.
- Change the color of the gridline by selecting a color from the Color drop-down list.
- Specify the width of the gridline in pixels by entering a number in the Width numeric input field.

