More actions
No edit summary |
No edit summary |
||
| Line 2: | Line 2: | ||
{{HelpFiles_Report_Module}} | {{HelpFiles_Report_Module}} | ||
==Color chart elements== | |||
This help section shows you how to color chart elements like chart areas, graph areas, label backgrounds, data series, and data points. | This help section shows you how to color chart elements like chart areas, graph areas, label backgrounds, data series, and data points. | ||
=No fill= | ===No fill=== | ||
=[[Image:6619.jpg|332px|Style sheet - Fill - No fill]]= | ====[[Image:6619.jpg|332px|Style sheet - Fill - No fill]]==== | ||
If you want the chart element to have no color, select ''No fill''. This option is not available for some chart elements like chart areas, data series, and data points. | If you want the chart element to have no color, select ''No fill''. This option is not available for some chart elements like chart areas, data series, and data points. | ||
=Solid fill= | ===Solid fill=== | ||
=[[Image:6620.jpg|364px|Style sheet - Fill - Solid fill]]= | ===[[Image:6620.jpg|364px|Style sheet - Fill - Solid fill]]=== | ||
If you want the chart element to have one consistent color, select ''Solid fill ''and then | If you want the chart element to have one consistent color, select ''Solid fill ''and then | ||
| Line 21: | Line 21: | ||
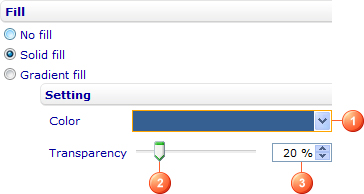
# Adjust the transparency of the color by moving the ''Transparency ''slider (2) or entering a number in the numeric input field next to the slider (3). You can vary the degree of transparency from 0% (fully opaque) to 100% (fully transparent). This setting is not available for some chart elements like chart areas. | # Adjust the transparency of the color by moving the ''Transparency ''slider (2) or entering a number in the numeric input field next to the slider (3). You can vary the degree of transparency from 0% (fully opaque) to 100% (fully transparent). This setting is not available for some chart elements like chart areas. | ||
=Gradient fill= | ===Gradient fill=== | ||
[[Image:6621.jpg|364px|Style sheet - Fill - Gradient fill]] | [[Image:6621.jpg|364px|Style sheet - Fill - Gradient fill]] | ||
Latest revision as of 07:00, 19 January 2012
Color chart elements
This help section shows you how to color chart elements like chart areas, graph areas, label backgrounds, data series, and data points.
No fill
If you want the chart element to have no color, select No fill. This option is not available for some chart elements like chart areas, data series, and data points.
Solid fill
If you want the chart element to have one consistent color, select Solid fill and then
- Change the fill color by selecting the color you want from the Color drop-down list (1).
- Adjust the transparency of the color by moving the Transparency slider (2) or entering a number in the numeric input field next to the slider (3). You can vary the degree of transparency from 0% (fully opaque) to 100% (fully transparent). This setting is not available for some chart elements like chart areas.
Gradient fill
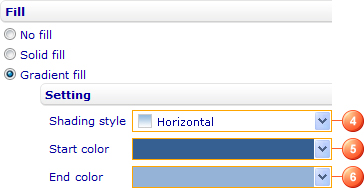
If you want the chart element to have a gradual progression of two colors, select Gradient fill and then
- Change the shading style of the gradient by selecting an option from the Shading style drop-down list (4). The available options are Horizontal, Vertical, Diagonal up, Diagonal down, From corner and From center.
- Change the start color and end color of the gradient by selecting the colors you want from the Start color and End color drop-down lists (5 & 6).


