More actions
No edit summary |
No edit summary |
||
| (One intermediate revision by the same user not shown) | |||
| Line 1: | Line 1: | ||
__NOTOC__ | |||
[[Category:Diagram/report_generating_CGScript_functions]] | |||
Creates a stack cross diagram from the axis names specified as string arrays for rows and columns. A unique id is returned when a diagram is added. | Creates a stack cross diagram from the axis names specified as string arrays for rows and columns. A unique id is returned when a diagram is added. | ||
==Syntax == | |||
createStackCrossDiagram(rowAxisNames, {columnAxisNames}); | createStackCrossDiagram(rowAxisNames, {columnAxisNames}); | ||
==Arguments== | |||
rowAxisNames: An array expression. This array contains the names of the axes which are used for the rows in the stack cross diagram; | rowAxisNames: An array expression. This array contains the names of the axes which are used for the rows in the stack cross diagram; | ||
| Line 17: | Line 15: | ||
{{note}}A limit of 2 rows and 2 columns is set at the moment. If an array (rowAxisNames or columnAxisNames) containing two axes, We will have multi-level diagrams. | {{note}}A limit of 2 rows and 2 columns is set at the moment. If an array (rowAxisNames or columnAxisNames) containing two axes, We will have multi-level diagrams. | ||
==Return type== | |||
number; | number; | ||
==Examples== | |||
<source lang="javascript"> | <source lang="javascript"> | ||
Latest revision as of 09:29, 24 January 2017
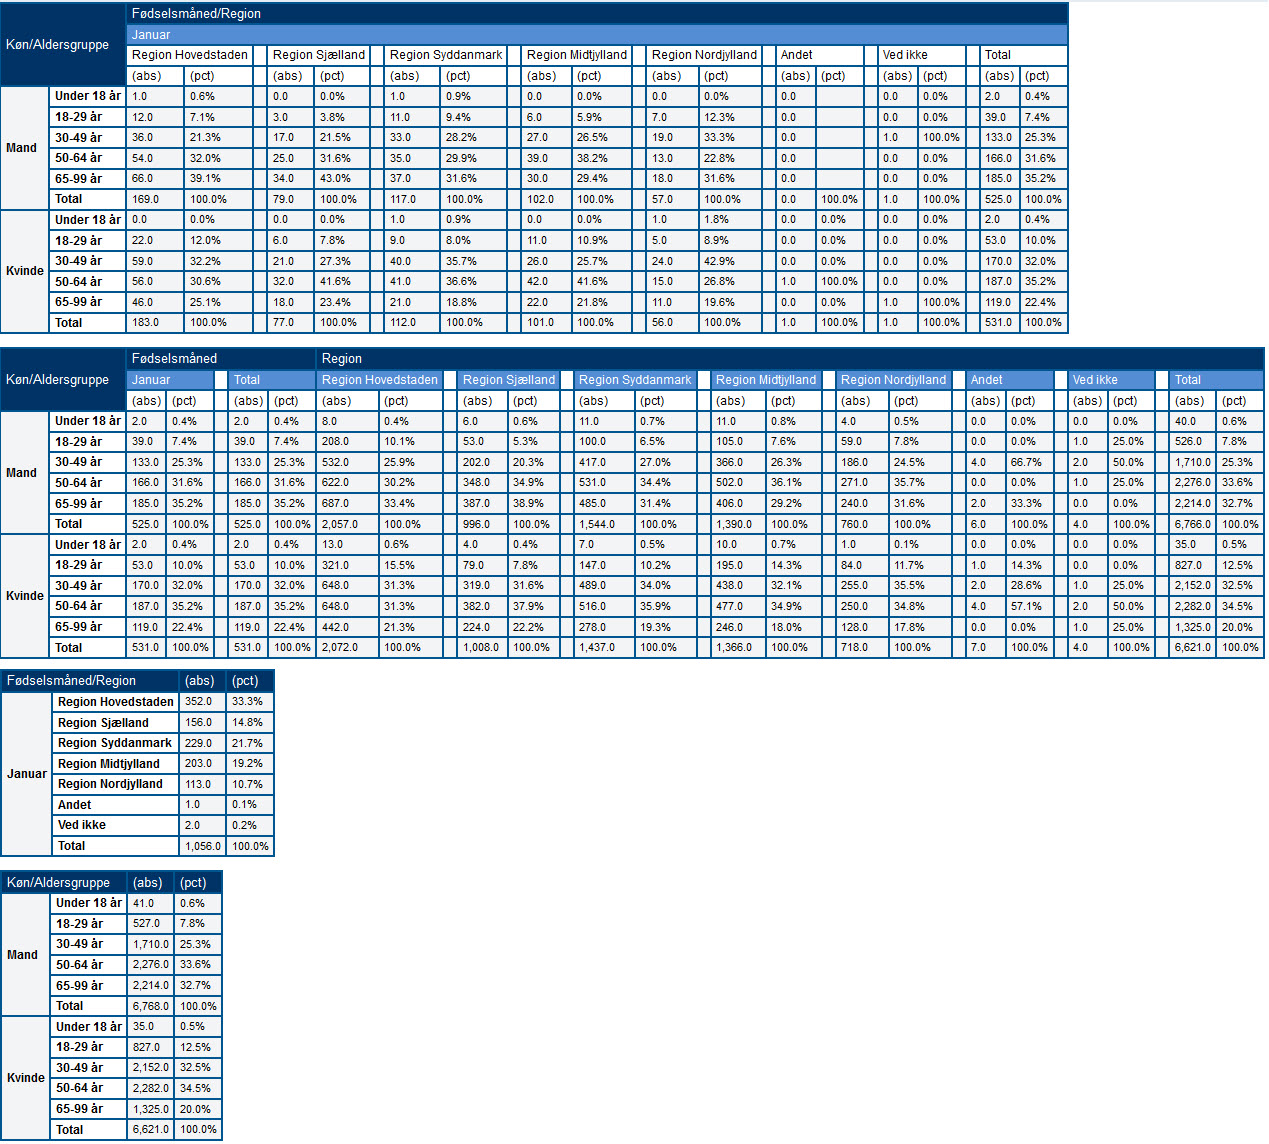
Creates a stack cross diagram from the axis names specified as string arrays for rows and columns. A unique id is returned when a diagram is added.
Syntax
createStackCrossDiagram(rowAxisNames, {columnAxisNames});
Arguments
rowAxisNames: An array expression. This array contains the names of the axes which are used for the rows in the stack cross diagram;
columnAxisNames: An array expression. This array contains the names of the axes which are used for the columns in the stack cross diagram.
![]() Note: A limit of 2 rows and 2 columns is set at the moment. If an array (rowAxisNames or columnAxisNames) containing two axes, We will have multi-level diagrams.
Note: A limit of 2 rows and 2 columns is set at the moment. If an array (rowAxisNames or columnAxisNames) containing two axes, We will have multi-level diagrams.
Return type
number;
Examples
DCS_use(15321022);
number table1 = createStackCrossDiagram({"QA1","D_Age_Group"}, {{"QA2a_Januar","D_QA4"}});
print(table1); //Result: 1
number table2 = createStackCrossDiagram({"QA1","D_Age_Group"}, {{"QA2a_Januar"},{"D_QA4"}});
print(table2); //Result: 2
number table3 = createStackCrossDiagram({}, {{"QA2a_Januar","D_QA4"}});
print(table3); //Result: 3
number table4 = createStackCrossDiagram({"QA1","D_Age_Group"}, {{}});
print(table4); //Result: 4
Result:

