More actions
No edit summary |
No edit summary |
||
| Line 1: | Line 1: | ||
[[Category:Formatting charts]] | [[Category:Formatting charts]] | ||
| {{HelpFiles_Report_Module}} | ||
====Position chart elements==== | ====Position chart elements==== | ||
Revision as of 04:16, 14 December 2011
Position chart elements
To position a chart element
Step 1: Specify the position of the chart element in the chart
- Specify the distance between the chart element and the left edge of the chart as a percentage of the width of the chart by entering a number in the X numeric input field (2).
- Specify the distance between the chart element and the top edge of the chart as a percentage of the height of the chart by entering a number in the Y numeric input field (3).
Step 2: Align the chart element relative to the position specified in step 1 by selecting a point from the Reference Point Locator control (1)
- Select one of the left points to align the left edge of the chart element to the position. This means that the number in the X numeric input field is the distance from the left edge of the chart to the left edge of the chart element.
- Select one of the center points to align the center of the chart element to the position. This means that the number in the X numeric input field is the distance from the left edge of the chart to the center of the chart element.
- Select one of the right points to align the right edge of the chart element to the position. This means that the number in the X numeric input field is the distance from the left edge of the chart to the right edge of the chart element.
- Select one of the top points to align the top edge of the chart element the position. This means that the number in the Y numeric input field is the distance from the top edge of the chart to the top edge of the chart element.
- Select one of the middle points to align the middle of the chart element to the position. This means that the number in the Y numeric input field is the distance from the top edge of the chart to the middle of the chart element.
- Select one of the bottom points to align the bottom edge of the chart element to the position. This means that the number in the Y numeric input field is the distance from the top edge of the chart to the bottom edge of the chart element.
Example
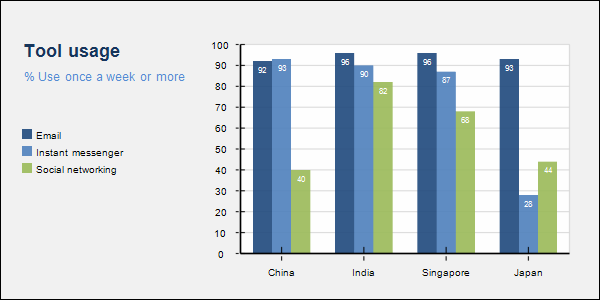
This example walks you through the process of positioning the graph area in a bar line chart. The position of the graph area, in the end, is expected to be like the picture below.
Step 1: Specify the position of the graph area in the chart by specifying X and Y
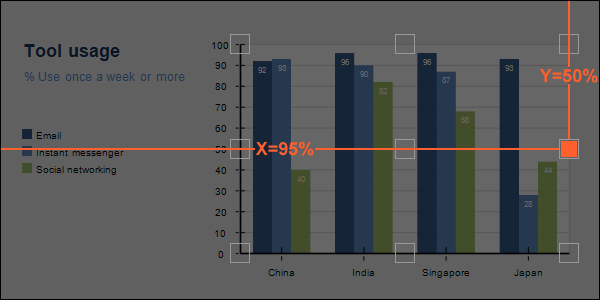
- X is the distance from the left edge of the chart to the left edge, the center, or the right edge of the graph area. In the picture, the distance between the right edge of the graph area and the right edge of the chart is about 5% of the width of the chart. This means the distance from the left edge of the chart to the right edge of the graph area is about 95% of the width of the chart. So we enter 95% in the X numeric input field.
- Y is the distance from the top edge of the chart to the top edge, the middle, or the bottom edge of the graph area. In the picture, the graph area is in the middle of the chart. This means the distance from the top edge of the chart to the middle of the graph area is 50% of the width of the chart. So we enter 50% in the Y numeric input field.
Step 2: Align the graph area relative to the position specified in step 1
- When we specified X and Y in step 1, we assumed that they were the distances from the left edge and the top edge of the chart to the right edge and the middle of the graph area. So all we have to do in this step is to select the right-middle point
 from the Reference Point Locator control.
The picture below may help you better visualize the process that we have just gone through.
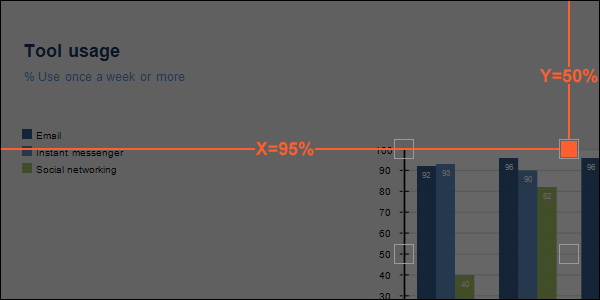
If we, in step 2, select the center-top point ![]() from the Reference Point Locator control by accident instead of the right-middle one, we will get the following weird result.
from the Reference Point Locator control by accident instead of the right-middle one, we will get the following weird result.


