More actions
No edit summary |
No edit summary |
||
| Line 1: | Line 1: | ||
== Questionnaire statistics == | |||
Questionnaire statistics is a feature to analyse how much time it took to carry out answer sheets after they were finished. There are three possible methods for analysis. | |||
*Average time to complete questionnaire | |||
*Average time to complete question type | |||
*Average time to complete question | |||
For each of these analysis types we can choose which answer sheets to include based on a number of filters. | |||
[[Image:3441.png|650px|Qstats4]] | |||
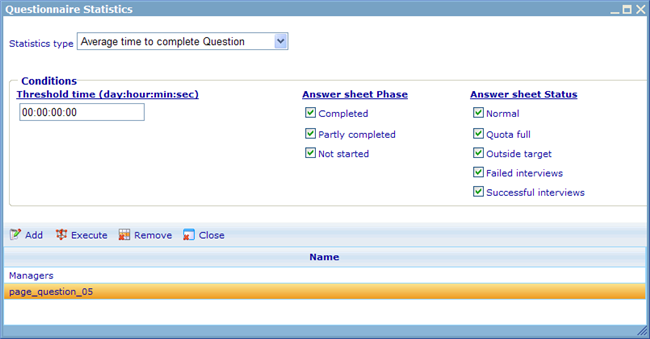
These filters decide whether or not answer sheets of chosen questionnaires will be included for the statistical results. The filters that exist are: | |||
'''Threshold time:''' sets a limit for those answer sheets we want included in the results based on how long time it took the respondent to answer. Any answer sheets that took longer time than the threshold time to answer will be excluded from the results. This will help weed out irregular cases that may affect the results heavily. Note that zero means include all. | |||
''' | '''Answer sheet phase:''' Decides whether or not answer sheets that were completed or only partly completed will be included in the analysis. Note that none checked means include all. | ||
'''Answer sheet | '''Answer sheet status: '''Decides if there are any specific statuses that should be included or excluded. Note that none checked means include all. | ||
Depending on the statistics type that we choose there will be different things we can add in the bottom list. | |||
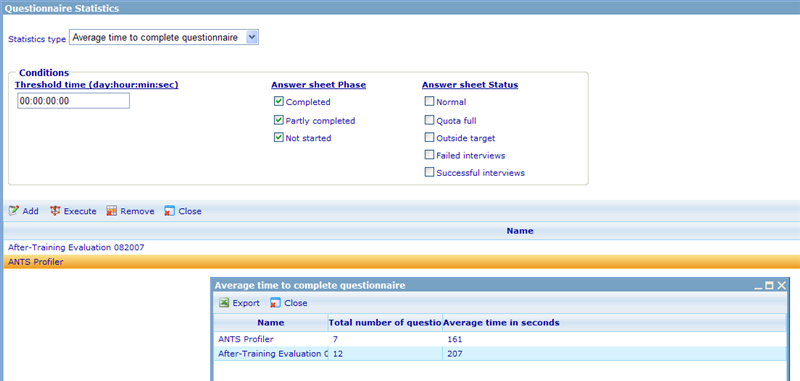
For '''average time to complete questionnaire''', we can add one or more questionnaires. When we click execute we will see the following report. | |||
[[Image:3442.png|800px|Qstats5]] | |||
This report shows us the number of questions in the chosen questionnaire and the average time it took in seconds to finish the answer sheet. | |||
The second report we can carry out is '''average time to complete question type'''. Also for this type of analysis we can add any number of questionnaires. | |||
[[Image:3443.png|800px|Q stats 6]] | |||
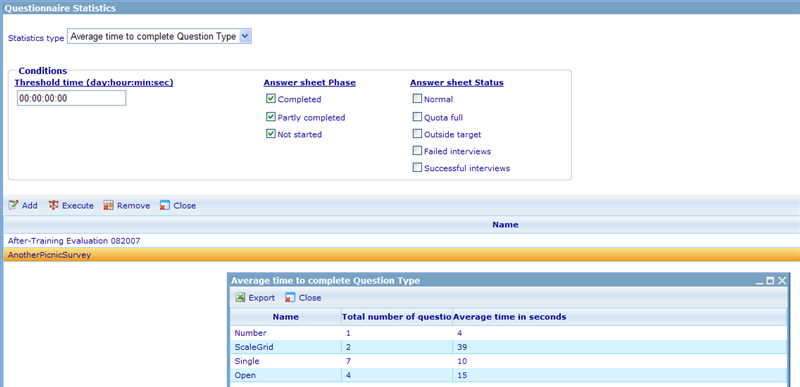
What the report will show (as illustrated above) is the the total number of questions of different question types across these questionnaires and the time it took in average to answer each one of them. | |||
The final statistics type that we have is '''average time to complete question'''. This one differs slightly from the two other ones in that we for this one must choose questions of questionnaires, rather than just questionnaires. This is done via a dialog where you must choose a questionnaire and then all questions will appear below. You can then choose to insert chosen questions into the criteria for the report. These questions will then be shown in the list where the questionnaires to be used in the statistics were shown for the other two analysis types. | |||
[[Image:3444.png|800px|Qstats7]] | |||
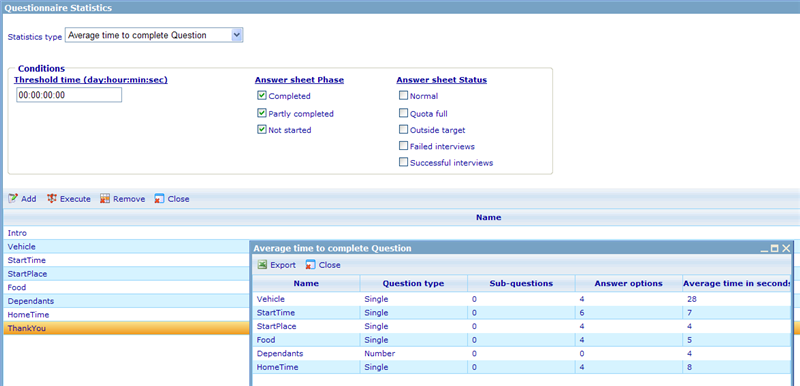
The report type that will be displayed will analyse one question at a time. For each question the type and number of sub questions and answer options will be shown. The final column will show the average time in seconds it took respondents to answer the question. | |||
You will be able to see statistical results in detail on the samples tab of questionnaire. __NOTOC__ <!-- imported from file: 3433.htm--> | |||
[[Category:Questionnaire_time_management]] | |||
Latest revision as of 05:13, 22 December 2011
Questionnaire statistics
Questionnaire statistics is a feature to analyse how much time it took to carry out answer sheets after they were finished. There are three possible methods for analysis.
- Average time to complete questionnaire
- Average time to complete question type
- Average time to complete question
For each of these analysis types we can choose which answer sheets to include based on a number of filters.
These filters decide whether or not answer sheets of chosen questionnaires will be included for the statistical results. The filters that exist are:
Threshold time: sets a limit for those answer sheets we want included in the results based on how long time it took the respondent to answer. Any answer sheets that took longer time than the threshold time to answer will be excluded from the results. This will help weed out irregular cases that may affect the results heavily. Note that zero means include all.
Answer sheet phase: Decides whether or not answer sheets that were completed or only partly completed will be included in the analysis. Note that none checked means include all.
Answer sheet status: Decides if there are any specific statuses that should be included or excluded. Note that none checked means include all.
Depending on the statistics type that we choose there will be different things we can add in the bottom list.
For average time to complete questionnaire, we can add one or more questionnaires. When we click execute we will see the following report.
This report shows us the number of questions in the chosen questionnaire and the average time it took in seconds to finish the answer sheet.
The second report we can carry out is average time to complete question type. Also for this type of analysis we can add any number of questionnaires.
What the report will show (as illustrated above) is the the total number of questions of different question types across these questionnaires and the time it took in average to answer each one of them.
The final statistics type that we have is average time to complete question. This one differs slightly from the two other ones in that we for this one must choose questions of questionnaires, rather than just questionnaires. This is done via a dialog where you must choose a questionnaire and then all questions will appear below. You can then choose to insert chosen questions into the criteria for the report. These questions will then be shown in the list where the questionnaires to be used in the statistics were shown for the other two analysis types.
The report type that will be displayed will analyse one question at a time. For each question the type and number of sub questions and answer options will be shown. The final column will show the average time in seconds it took respondents to answer the question.
You will be able to see statistical results in detail on the samples tab of questionnaire.


