More actions
jrfconvert import |
No edit summary |
||
| Line 1: | Line 1: | ||
[[Category: | [[Category:Formatting charts]] | ||
| | ||
Revision as of 06:32, 30 March 2011
Change the font formatting of chart elements
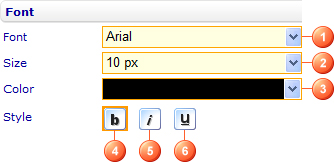
Using the above group of settings to change the font formatting of chart titles, legend entries, axis labels, radar labels, data labels, and custom labels, you can:
- Change their font type by selecting an option from the Font drop down-down list (1). The available options are Arial, Courier New, Lucida Sans Unicode, Ms Sans Serif, Tahoma, Times New Roman, and Verdana.
- Change their font size by selecting an option from the Size combo box (2). You can also enter the size you want in the box if it is not in the list.
- Change their font color by selecting a color from the Color drop-down list (3).
- Make them bold by selecting Bold (4), italicize them by selecting Italic (5), or underline them by selecting Underline (6).

