More actions
No edit summary |
No edit summary |
||
| Line 1: | Line 1: | ||
[[Category:Preview external style sheets]] | [[Category:Preview external style sheets]] | ||
| {{HelpFiles_Report_Module}} | ||
====Preview an external style sheet==== | ====Preview an external style sheet==== | ||
Revision as of 04:17, 14 December 2011
Preview an external style sheet
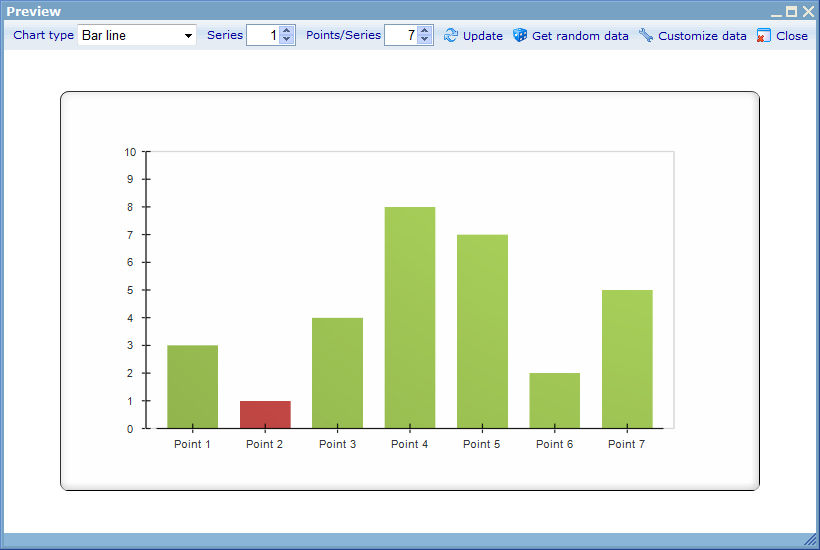
Previewing your external style sheet is as easy as clicking the Preview button on the toolbar of the External Style Sheet editor to open the Preview dialog.
Figure 1: Preview Dialog
The Preview dialog displays a random chart with your current style sheet settings, whether you have saved them or not. You can perform the following tasks to view the chart in a certain way:
- Change chart type: You can see how the chart is displayed in a different chart type by selecting the one you want from the Chart type dropdown list and clicking the Update button.
- Change the number of series: You may want to see how the chart is displayed with a certain number of series. You can do this by inputting the number of series you want (up to 100) into the Series input field and clicking the Update button. Notice that the allowed number of series depends on the chart type you select. For example, you cannot change the number of series of a pie chart to any number different than 1.
- Change the number of points per series: You may want to see how the chart is displayed with a certain number of points per series. You can do this by inputting the number of points per series you want (up to 100) into the Points/series input field and clicking the Update button.
- Randomize data: You may want to refresh the chart with another set of randomized data. You can do this by simply clicking the Get random data button.
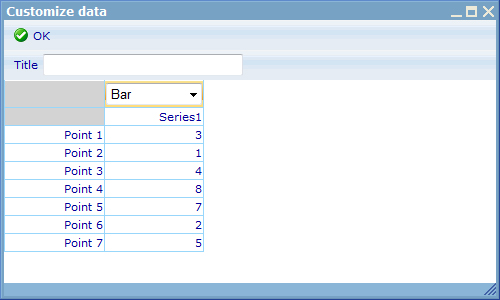
- Customize data: If you want to see the chart with your own data, you can open the Customize data dialog by clicking the Customize data button and input your data into it. You can change the chart title and labels of data series and data points, and if the chart is a bar line chart, you can also specify which series is bar or line through the dialog. The chart is updated when you click OK.
Figure 2: Customize Data Dialog


