More actions
No edit summary |
No edit summary |
||
| Line 121: | Line 121: | ||
| | ||
<br> | <br>'''4. Save the Data Cache.<br><u>Step 3. </u>Create Dashboard item whose type is Cross diagram.'''<br> 1. Go to Dashboard list (Tools/ Reports/ Dashboard).<br> 2. Create a new dashboard or edit an existing one. <br> 3. In General Information tab: Data caches list must have the DCS which is created at step 1&2.<br> 4. Layout tab: Create Dashboard items.<br> 4.1 Create Dashboard (DB) item 1 whose type is Shown axis. <br> o Data cache: use the DCS which is created at step 1&2.<br> o This DB item will be used as the X-axis of the cross diagram that has 12 options: Jan, Feb, Mar,… Dec<br> 4.2 Create Dashboard (DB) item 2 whose type is Shown axis. <br> o Data cache : use the DCS which is created at step 1&2.<br> o This DB item will be used as Y-axis of the cross diagram that has 2 options: Last Year and This Year.<br> 4.3 Create Dashboard (DB) item 3 whose type is Cross diagram :<br> o Data cache: use the DCS which is created at step 1&2.<br> o Chart type: Line<br> o X – axis: must be DB item 4.1<br> o Y – axis: must be DB item 4.2<br> o Style sheet: choose a style sheet which is created in the Style sheet list.<br> o Data format: absolute<br> o Direction: Vertical<br> 5. Insert these Dashboard items to the HTML editor then save the Dashboard. | ||
''' | |||
// Finish creating the diagram. | // Finish creating the diagram. | ||
Revision as of 07:54, 4 September 2009
The diagram above is a cross diagram which is made by crossing 2 axes together:
- The X-axis has 12 options: Jan, Feb, Mar, … Dec
- The Y- axis has 2 options: This Year and Last Year. Calculations for these options are based on values stored in a custom column in the data cache. These values, which are calculated on corresponding values in the EndDate column, indicate whether an RPQ was finished in this year or last year.
The following steps show you how to create the above diagram
Step 1.Create a new axis set in DCS list based on the EndDate column, this axis will be used as the y-axis of the cross diagram in Dashboard.
1. Open the Data Cache in Data Cache list (Tools/Data/Data Caches).
2. In the Data Cache tab:
2.1 Select Column’s type then click “Add Column” button to insert a new Custom column
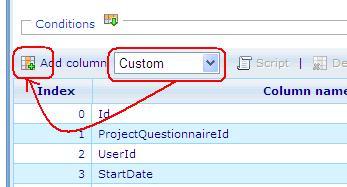
- A new Custom column is used to define the year which this record is related to.
- Data type : Number
- Save numbers : 0,1 and null.
0 : if the year of the EndDate column is the same with the current year in the system.
1 : if the year of the EndDate column is in the previous year of current year in the system.
Null : if the year of the EndDate column is in other years.
2.2 Put the CGScript which defines Current Year and Last Year

- Input Name of the Custom column, this name will be an option of the axis set.
- Insert the CGSript.
| // CGScript array a = stringSplit(EndDate, " "); string s = a[0]; a = stringSplit(s, "/"); number endDateYear = convertToNumber(a[2]); number endDateMonth = convertToNumber(a[0]); number endDateDay = convertToNumber(a[1]); array today = getDateTime(); number todayYear = today[DateTime_Year]; number todayMonth = today[DateTime_Month]; number IsLastYear = 1; number IsThisYear = 0; if (endDateYear == todayYear) return IsThisYear; if (endDateYear == todayYear-1) return IsLastYear; //End Script |
- Save the Custom column.
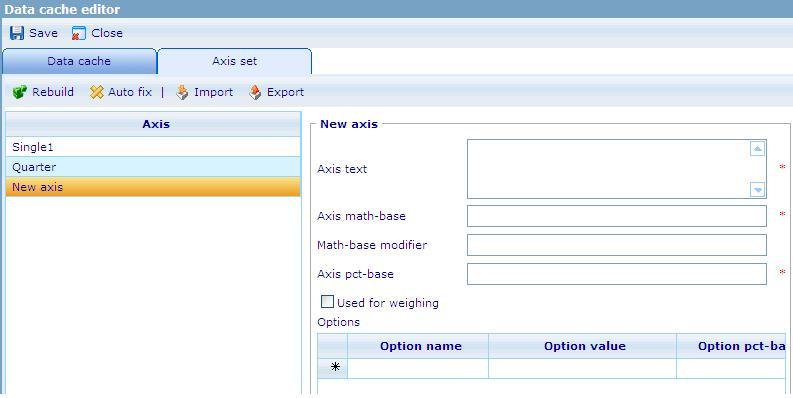
3. Go to the Axis set tab: Create a new axis set
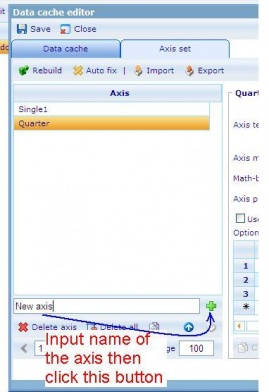
3.1 Create a new axis set
'
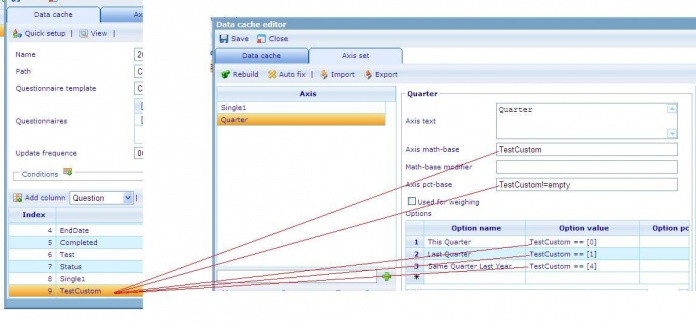
3.2 Input value to the new axis set
Axis math – base, Axis pct – base, Option value : will be used the Custom column’s name.
For example :
4. Save the Data cache.
Step 2. Create a new axis set in DCS list based on the EndDate column, this axis will be used as the x-axis of the cross diagram in Dashboard.
1. Open the Data Cache in Data Cache list (Tools/ Data / Data Caches)
2. In the Data Cache tab:
2.1. Select Column’s type then click “Add Column” button to insert a new Custom column.
- A new Custom column is used to define the month of EndDate.
- Data type : Number
- Save numbers : 1,2,3,4,5,6,7,8,9,10,11 and 12.
1: the month of the EndDate is January.
2: the month of the EndDate is February.
3: the month of the EndDate is March.
4: the month of the EndDate is April.
5: the month of the EndDate is May.
6: the month of the EndDate is June.
7: the month of the EndDate is July.
8: the month of the EndDate is August.
9: the month of the EndDate is September.
10: the month of the EndDate is October.
11: the month of the EndDate is November.
12: the month of the EndDate is December.
2.2 Put the CGScript which defines Current Year and Last Year 
- Input Name of the Custom column, this name will be an option of the axis set.
- Insert the CGSript.
| // CGScript array a = stringSplit(EndDate, " "); string s = a[0]; a = stringSplit(s, "/"); number endDateYear = convertToNumber(a[2]); number endDateMonth = convertToNumber(a[0]); number endDateDay = convertToNumber(a[1]); return endDateMonth; //End Script |
- Save the Custom column.
3. Go to the Axis set tab: Create a new axis set
a. Create a new axis set :
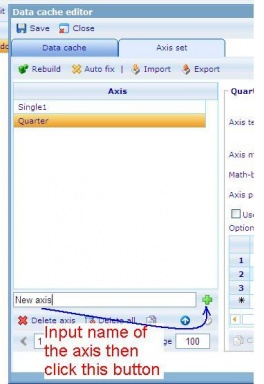
b. Input value to the new axis set.
Axis math – base, Axis pct – base, Option value : will be used the Custom column’s name.
For example : Custom column’s name is Month.
| Option name | Option value |
| Jan | Month == [1] |
| Feb | Month == [2] |
| Mar | Month == [3] |
| Apr | Month == [4] |
| May | Month == [5] |
| Jun | Month == [6] |
| Jul | Month == [7] |
| Aug | Month == [8] |
| Sep | Month == [9] |
| Oct | Month == [10] |
| Nov | Month == [11] |
| Dec | Month == [12] |
4. Save the Data Cache.
Step 3. Create Dashboard item whose type is Cross diagram.
1. Go to Dashboard list (Tools/ Reports/ Dashboard).
2. Create a new dashboard or edit an existing one.
3. In General Information tab: Data caches list must have the DCS which is created at step 1&2.
4. Layout tab: Create Dashboard items.
4.1 Create Dashboard (DB) item 1 whose type is Shown axis.
o Data cache: use the DCS which is created at step 1&2.
o This DB item will be used as the X-axis of the cross diagram that has 12 options: Jan, Feb, Mar,… Dec
4.2 Create Dashboard (DB) item 2 whose type is Shown axis.
o Data cache : use the DCS which is created at step 1&2.
o This DB item will be used as Y-axis of the cross diagram that has 2 options: Last Year and This Year.
4.3 Create Dashboard (DB) item 3 whose type is Cross diagram :
o Data cache: use the DCS which is created at step 1&2.
o Chart type: Line
o X – axis: must be DB item 4.1
o Y – axis: must be DB item 4.2
o Style sheet: choose a style sheet which is created in the Style sheet list.
o Data format: absolute
o Direction: Vertical
5. Insert these Dashboard items to the HTML editor then save the Dashboard.
// Finish creating the diagram.


