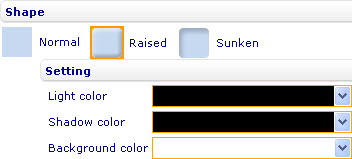
Shape of a chart
To change the shape of a bar line, pie, area, point, radar, funnel, bubble, linear gauge, radial gauge, or box and whiskers chart through the External Style Sheet and Inline Style Sheet editors:
- Under Chart area, select Chart shape, and then find the Shape group of settings on the right-hand area.
- Select Normal, Raised, or Sunken.
- If you have selected Raised or Sunken, go on to specify the light color, shadow color, and background color of the shape by selecting colors from the Light color, Shadow color, and Background color drop-down lists respectively.
Note: The background color of the shape is not the color of the chart area.


