Position the data labels
To position the data labels in a bar line, area, point, radar, bubble, or box and whiskers chart through the External Style Sheet and Inline Style Sheet editors:
- Under Labels, select Data labels, and then find the Position group of settings on the right-hand area.
- To place the data labels at the center of their associated data points, select Center.
- To place the data labels a number of pixels above their associated data points, select Above and enter a number in the numeric input field next to the option.
- To place the data labels a number of pixels below their associated data points, select Below and enter a number in the numeric input field next to the option.
To position the data labels in a pie chart through the External Style Sheet and Inline Style Sheet editors:
- Under Labels, select Data labels, and then find the Position group of settings on the right-hand area.
- To place the data labels at the center of their associated pie segments, select Center.
- To place the data labels round the pie, select Rim.
- To align the data labels vertically on either side of the pie, select Spider.
- There are leader lines that connect the data labels to their associated pie segments in the Rim or Spider mode. A leader line has two connected straight line segments called arrow and pointer. The pointer is a horizontal line that starts from the data label and goes toward the pie. The arrow starts from the center of the edge of the pie segment and connects to the pointer. You can specify the length in pixels of the arrows in either mode by entering a number in the Arrow length numeric input field. You can also specify the length in pixels of the pointers in the Rim mode and the shortest pointer in the Spider mode by entering a number in the Pointer length numeric input field. The length of the other pointers in the Spider mode is automatically adjusted according to the length of the shortest one so that the data labels on either side of the pie are properly aligned.
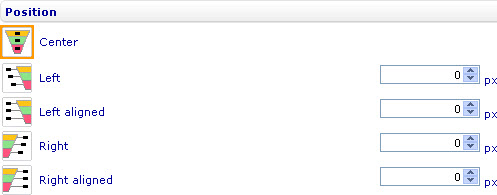
To position the data labels in a funnel chart through the External Style Sheet and Inline Style Sheet editors:
- Under Labels, select Data labels, and then find the Position group of settings on the right-hand area.
- To place the data labels at the center of their associated funnel segments, select Center.
- To place the data labels on the left of the funnel without aligning them, select Left. You can specify the distance in pixels from the data labels to their associated funnel segments by entering a number in the numeric input field next to the option.
- To align the data labels vertically on the left of the funnel, select Left aligned. You can specify the smallest distance in pixels from a data label to its associated funnel segment by entering a number in the numeric input field next to the option. The distance from the other data labels to their associated funnel segments is automatically adjusted.
- To place the data labels on the right of the funnel without aligning them, select Right. You can specify the distance in pixels from the data labels to their associated funnel segments by entering a number in the numeric input field next to the option.
- To align the data labels vertically on the right of the funnel, select Right aligned. You can specify the smallest distance in pixels from a data label to its associated funnel segment by entering a number in the numeric input field next to the option. The distance from the other data labels to their associated funnel segments is automatically adjusted.


