More actions
Callouts
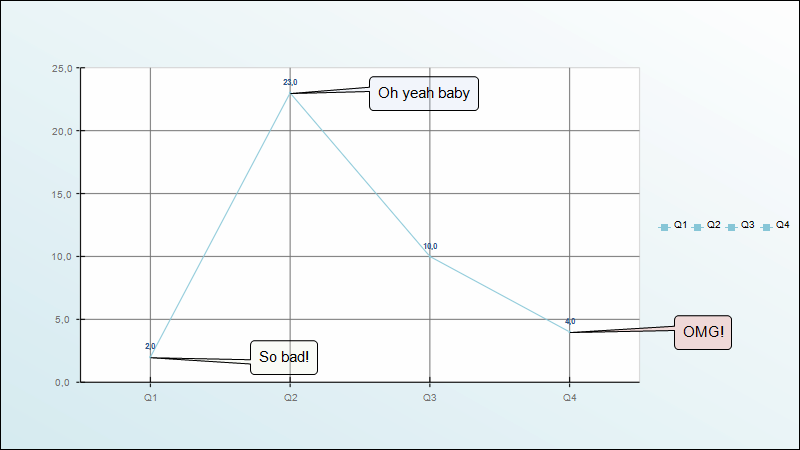
Callouts are used to link a data point (a specific result) in a line series of a bar line chart to a remark. The remark is placed in a callout, thereby its name. Below is an example of a line chart where a result has been given a callout.
As you will see there are 3 callouts. Each are linked to a data point of a series. "So bad!" is linked to Line Series 1, Data Point 1."Oh yeah baby" is linked to Line Series 1, Data Point 2."OMG!" is linked to Line Series 1, Data Point 4.
How to specify the location of a callout on a line series as well as the formatting of it (colors, font, format, etc) is explained in the below chapters.
Pages in category "Callouts"
The following 4 pages are in this category, out of 4 total.

