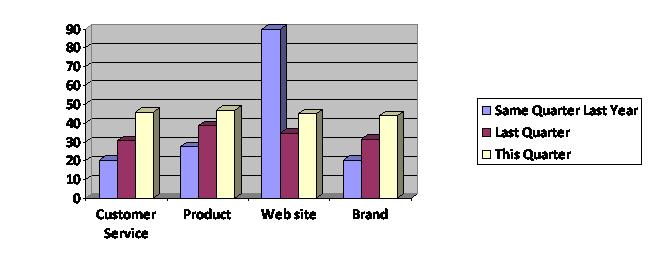
The diagram above is a cross diagram which is made by crossing 2 axes together:
- The x-axis has 4 options: Custom Service, Product, Web site and Brand.
- The y-axis has 3 options: Same Quarter Last Year, Last Quarter and This Quarter. Calculations for these options are based on values stored in a custom column in the data cache. These values, which are calculated on corresponding values in the EndDate column, indicate whether an RPQ was finished in this quarter, last quarter, or the same quarter last year.

