Dashboard element - cross diagram
Usage: This element generates information to show on a dashboard. The result of the element is a chart of the types bar, line, pie, radar, or table. Using this element is very similar to using a cross diagram as known from dynamic diagrams. You may understand better if you check out the help file on cross diagrams.
The main idea of this diagram is that you can use other elements to specify what will be used for x and y axes, as well as the filters that will specify the subset of data to be used for the diagram. Using a combination of a time set for x-axis and a viewable axis with brands for y-axis it is possible to recreate a tracking diagram identical to the one known from dynamic diagrams.
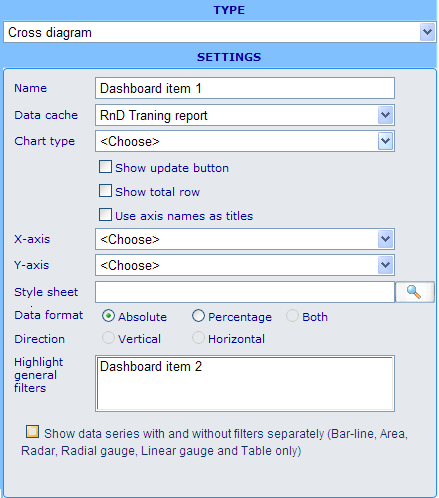
Example of editor format:
Settings in editor format: Besides the name field we have the following specific choices.
Data cache: You will be required to choose a data cache that is to be the data source for the cross diagram.
Chart type: Choose between bar, line, pie, radar, and table type charts. You choice will influence your available options for y-axis, data format, and direction.
Show update button: When this check box is not ticked, then this diagram will be regenerated each time any of its related filters are changed. If ticked then an update button will be shown on top of the diagram in the viewer. The diagram will then only be regenerated and related viewable filters only take effect when this button is clicked.
Show total row: Specifies whether or not the data that you get returned will need a total row. It makes most sense to use this feature together with table diagrams.
Use axis names as titles: Axis names originally are auto-generated from question names and often these may look better in charts than axis descriptions, that originate from the question texts.
X-axis: Choose between viewable axis, hidden axis, viewable time set, and hidden time set for the x-axis of your diagram.
Y-axis: Choose between viewable axis, hidden axis, viewable time set, and hidden time set for the y-axis of your diagram. Notice that y-axis cannot be added for pie charts, since these have just one series of data.
Style sheet: Choose a style sheet that will make your diagram look good. To know more about style sheets please click here.
Data format: Defines how the data generated for your axes will be shown. Choices are Absolute, Percentage or Both. Both is typically used only for table diagrams.
Direction: This defines how percentages of a table diagram will be calculated. Vertical means it will be as a percentage of the x-axis totals, Horizontal that it will be as a percentage of the y-axis totals.
Highlight general filters: All elements in the dashboard of the types viewable advanced filter, viewable simple filter, hidden filter, viewable weight and hidden weight will then be listed. To choose which of these filters that will have an effect on the diagram you need to highlight them on this list. When an element is highlighted then it will influence the results of the diagram element regardless of it being viewable or hidden. Difference is that you can in the dashboard viewer change settings in the viewable elements and hereby update the results of the diagram according to user wishes.
With and without filters: Doubles the number of series that will be shown in the diagram. Half will be shown using the above mentioned generak filters - the other half will not. The legend will indicate which series is being filtered.
Other elements that can utilize this element:
None - this element just uses other elements but has no filters or axes that it can send to other elements.
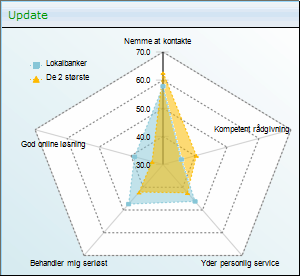
Example of viewable format:
- Notice the "Update" button on top of the diagram. This button only appears when the "Show update button" is ticked off for the element.
- The size of the diagram depends on the style sheet that the diagram is using. Please update style sheet if you want to change any graphical settings of a diagram.


