Usage: This will provide an opportunity to place a filter on the diagram or reports that you shown in your report, without showing or informing the viewer of the dashboard that such a filter has been applied.
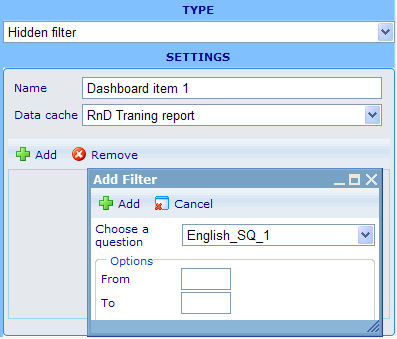
Example of editor format:
Settings in editor format: Besides the name field we have the following specific choices.
Data cache: The available data caches will be those that you added on the general information tab of the dashboard resource dialog. Choose the one which you also plan to use for the cross diagram, document report or standard diagram element(s) to which it will be associated.
Filter choice list: This is a small list with an "Add" and "Remove" button. When clicking "Add" button, a small add filter dialog will appear. In this dialog you can choose between all the axes related to the chosen data cache's axis set. If the axis you choose has answer options related to it, then you can choose those options that should be included. If the question is numeric or scale type, then you will be offered to specify a range in between which users to be included should have answered. When you click "Add" on the button of the dialog then the chosen new filter requirements will be added to the filter list. You can add as many simultaneous filters as you like. The users to be included will have to fulfill all.
Other elements that can utilize this element:
- Standard diagram
- Cross diagram
- Document report
Example of viewable format:
None - this element has no viewable format

