Dashboard element - viewable advanced filter
Usage: The advanced filter element will present the viewer of a dashboard with a highly flexible filter editor which, when used, can influence the subset of data used for diagrams and reports.
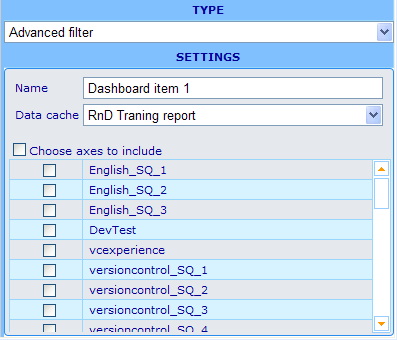
Example of editor format:
Settings in editor format: Besides the name field we have the following specific choices.
Data cache: The available data caches will be those that you added on the general information tab of the dashboard resource dialog. Choose the one which you also plan to use for the cross diagram, document report or standard diagram element(s) to which it will be associated.
Choose axes to include: Ticking off the check box next to this text will mass tick all the axes in the list below it. In this list you choose all those axes that may be available in the viewable format of the advanced filter element. Please see further down to understand how this element works in the viewer.
Other elements that can utilize this element:
- Standard diagram
- Cross diagram
- Document report
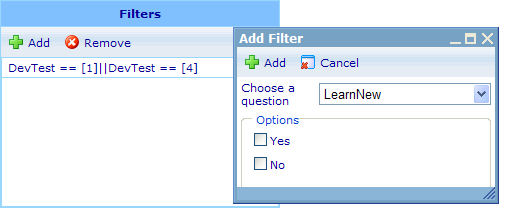
Example of viewable format:
The viewable advanced filter element is a small list with an "Add" and "Remove" button. When clicking "Add" button, a small add filter dialog will appear. In this dialog you can choose between all the axes that you have allowed for the advanced filter in the editor mode. If the axis you choose has answer options related to it, then you can choose those options that should be included. If the question is numeric or scale type, then you will be offered to specify a range in between which users to be included should have answered. When you click "Add" on the button of the dialog then the chosen new filter requirements will be added to the filter list. You can add as many simultaneous filters as you like. The users to be included will have to fulfill all.


