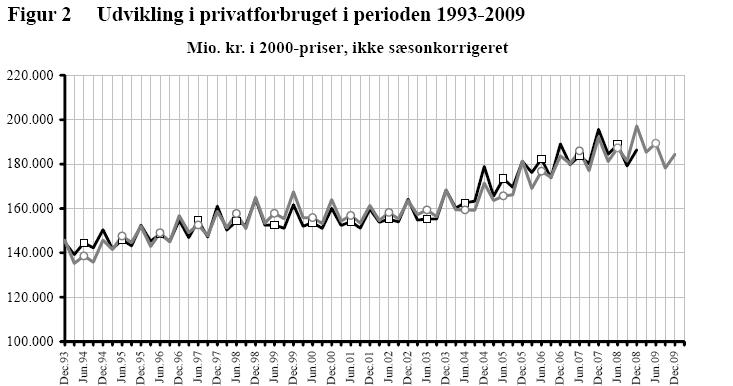
The diagram above is a cross diagram which is made by crossing 2 axes together:
- The x-axis will be used a time set.
- The y-axis will be the answer option which used to shown its value.
The following steps show you how to create the above diagram
Step 1.Create a new time set in Time set list.
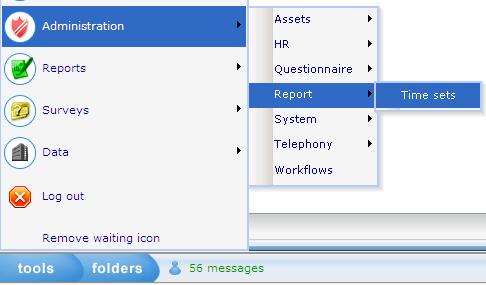
1. Open the Time set list (Tools/ Administration / Report/ Time sets).
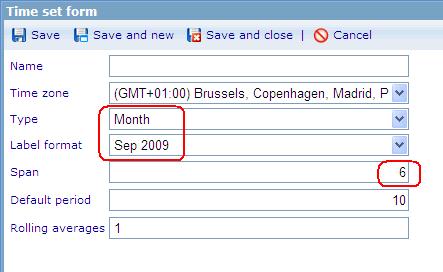
2. Create a new Time set :
- The new Time set is used to define the period of time.
- Type: Month
- Label format : select type likes "Sep 2009"
- Span : select 6 if user want to show value for each 6 months, or select Span = 3 if user want to show value for each quarter.
3. Save the Time set.
Step 2. Create Dashboard item whose type is Cross diagram.
1. Go to Dashboard list (Tools/ Reports/ Dashboard).
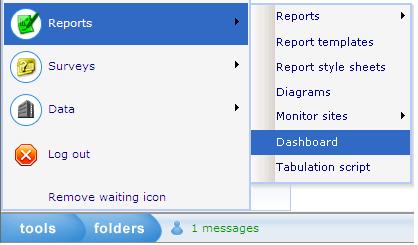
2. Create a new dashboard or edit an existing one.
3. In General Information tab: Data caches list must have the DCS which is used to make Cross diagram.
4. Layout tab: Create Dashboard items.
4.1 Create Dashboard (DB) item 1 whose type is Time set.
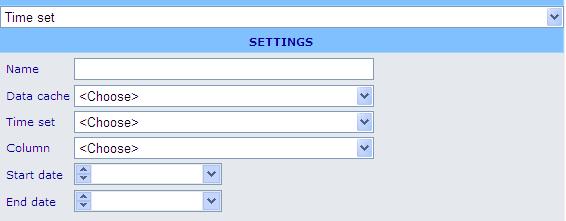
o Data cache: use the DCS which is used to make Cross diagram.
o Time set : select the Time set which is created at step 1.
o Column : select EndDate
o Start date : select the 1st of June.
4.2 Create Dashboard (DB) item 2 whose type is Shown axis.

o Data cache : use the DCS which is used to make Cross diagram.
o This DB item will be used as the y-axis of the cross diagram.
4.3 Create Dashboard (DB) item 3 whose type is Cross diagram :
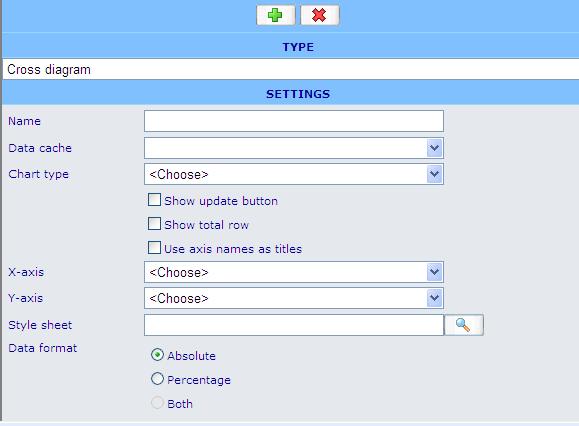
o Data cache: use the DCS which is used to make diagram.
o Chart type: Line
o X – axis: must be DB item 4.1
o Y – axis: must be DB item 4.2
o Style sheet: choose a style sheet which is created in the Style sheet list.
o Data format: absolute
o Direction: Vertical
5. Insert these Dashboard items to the HTML editor then save the Dashboard.
// Finish creating the diagram.

