<accesscontrol>Main:MyGroup</accesscontrol>
Introduction
The SpreadSheet framework aims at giving a flexible replacement to System.Data.DataTable in generation of Diagrams inside CatGlobe. Generally say, it consists of a 2 dimensions array of so-call Cell. Each cell can contain raw text, constant that is to be replaced, expression that is to be calculated.
At the out-most abstraction level, we can consider the process of generating SpreadSheet is the collaboration among the 4 separated parts.
- The SpreadSheet itself provides means for managing Cells
- The DataGeneration that fills SpreadSheet with data (include raw texts, constants and expressions)
- The ExpressionEngine that is in charge of calculating the expression
- The Presentation that converts a SpreadSheet into other sort of useful data representation like DataTable, HtmlTable
Releases information can be found here SpreadSheet Release Information
Design Decisions
- Due to the single responsibility of the SpreadSheet, it must be inside another assembly and that has no reference to any existing CatGlobe assembly.
Design Details
Component Diagram
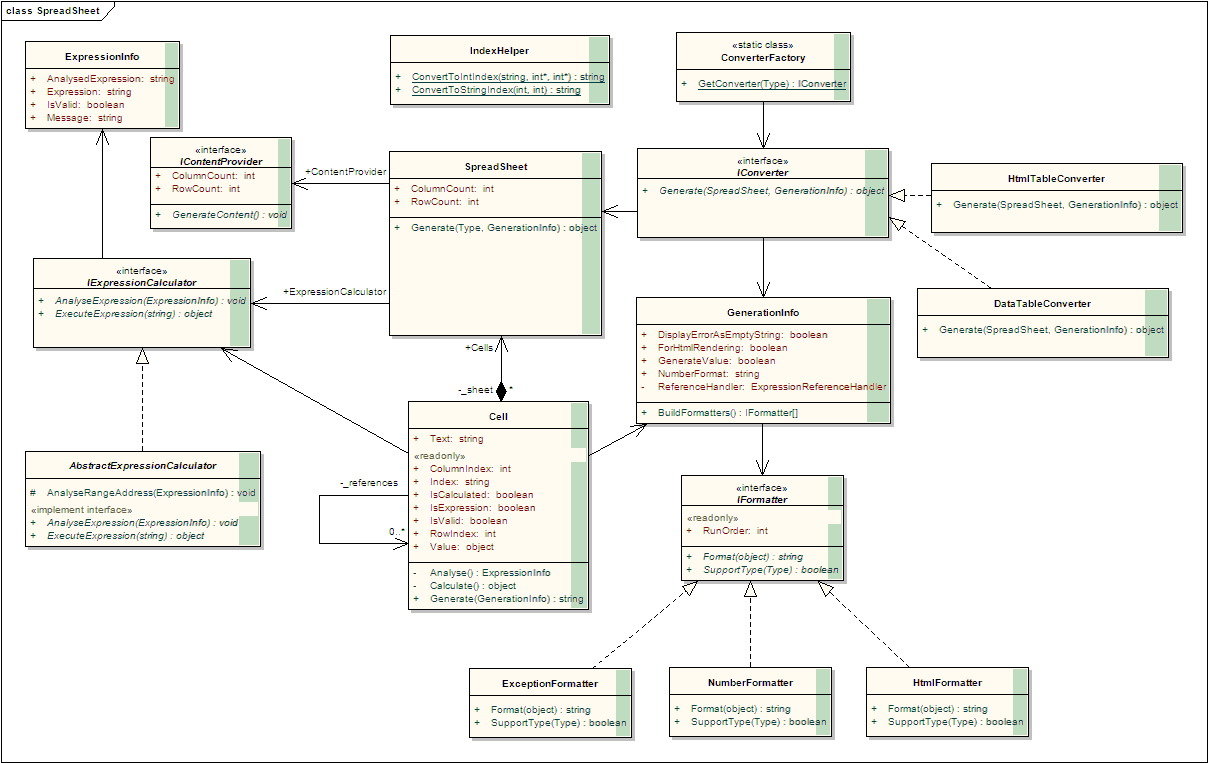
The component exposes 3 interfaces
- IContentProvider
- IExpressionCalculator
- IConverter
The first 2 interfaces act like producers that fill the SpreadSheet with texts/constants/expressions and calculating the expression. The third one, in the other hand, acts like consumers that use ready-to-use data of SpreadSheet in different ways.
Class Diagram
SpreadSheet contains a 2-dimensions array of Cell and it also contains the 2 input-points to outside implementations which will fill the SpreadSheet with data and calculate expressions whenever needed.
A Cell has only one set-able property named Text. There is no distinction between a text and an expression that the developer need to know about. Instead, they set the cell with its Text property and leave the remaining work to the cell.
Cellhas 3 index properties. RowIndex, ColumnIndex which are zero-base integer indexes. The other Index is Excel-like string index.
Cell also has properties for checking its content. IsExpression tells that a cell's value is raw-text or expression. If it contains an expression then IsValid tells whether the expression is valid or not, and IsCalculated tells that whether accessing to Value would return a calculated value or nothing.
Setting value to a Cell
Example code:
SpreadSheet _spreadSheet = new SpreadSheet(...);
_spreadSheet[0,0].Text = "This is a label";
_spreadSheet[0,1].Text = "=(sum(A1:B1))";
Code on line 2 attempts to set a text value into cell at index [0,0], the following steps would happen:
- The reference list is cleared
- IsExpression is set to false
- IsValid is set to true
- IsCalculated is set to true
- Value is set to the same value as Text
Code on line 3 attemps to set an expression into cell at index [0,1], the following steps would happen:
- IsExpression is set to true
- IsCalculated is set to false
- The expression is then analyzed
- If the expression is not OK then:
- IsValid is set to false
- IsCalculated is set to true
- Value is set to blank
- If the expression is OK then:
- IsValid is set to true
- IsCalculated is set to false
- If the expression is not OK then:
Getting value of a Cell
In case of text, the text is returned back to user without any further processing. But in case of expression, the real value is not calculated until its first use. If the expression is not valid, then the returned value is the message showing the information of invalidity. Otherwise, the calculated value is returned.
The steps of calculating an expression is as follows:
- Collect all values of cells that this cell refer to. For example: if cell A1 has a formula of sum(C1:C2) then the 2 values of C1 and C2 are collected. By doing this, we force the referred cells to calculate their values first.
- Send the cell's expression and its referred cell/value pairs to the expression engine for calculation
- If the calculation has exception then the returned value is the Exception itself
Formatting value of a Cell
Value of cell might need to be refined a bit before showing to end-user. For example: Exception might be replaced with empty string of ERR string, number must have 3 digits in decimal part.
To achieve this, developer must call to Generate method:
public string Generate(GenerationInfo info)
{
    string value = string.Empty;
    object obj = info.GenerateValue ? Value : Text;
    Type valueType = info.GenerateValue ? Value.GetType() : typeof(string);

    IFormatter[] formatters = info.BuildFormatters();
    foreach (IFormatter f in formatters)
    {
        if (f.SupportType(valueType))
            value = f.Format(obj);
    }

    return value;
}
The GenerationInfo class provide a BuildFormatters method that provides a list of IFormatters implementation that are used for formatting cell's value. Currently, the GenerationInfo contains just enough information for formatting a single case of CrossDiagramGenerator and need to be refined later on.
The current implementation provides 3 different Formatter:
- ExceptionFormatter: replace an Exception with a text
- NumberFormatter: format number with .NET standard number format. Ex: 0.##, ###0.00
- HtmlFormatter: encode string text to render to HTML browser
Convert SpreadSheet to presentation object
Each kind of presentation must be implemented in a separate class which implement interface IConverter. Version 0.1 of SpreadSheet component has a converter that convert SpreadSheet to System.Data.DataTable as below:
   internal class DataTableConverter : IConverter
   {
      #region ISpreadSheetConverter Members

      public object Generate(SpreadSheet sheet, GenerationInfo info)
      {
         DataTable dt = new DataTable("ChartData");
         for (int c = 0; c < sheet.ColumnCount; c++)
         {
            dt.Columns.Add();
         }
         for (int r = 0; r < sheet.RowCount; r++)
         {
            dt.Rows.Add((from c in sheet[r]
                         select c.Generate(info))
                         .ToArray());
         }
         return dt;
      }

      #endregion ISpreadSheetConverter Members
   }
Single case of CrossDiagramGenerator
The case
- Database: catsql - DK_FROM_20080914_FOR_57
- Initialization code:
         QuestionnaireCacheSpecification Specification = QuestionnaireCacheSpecification.GetBy(2317);
         Parameter parameter = new Parameter
               {
                  DataCache = Specification,
                  ColumnList = "0",
                  RowList = "1",
                  ShowMode = ShowType.Both,
                  ChartType = CatGlobe.Domain.Reports.Parameters.ChartType.Table,
                  Direction = DirectionType.Vertical,
                  Filters = new string[0] { },
                  StatisticalOutput = true,
                  Median = true,
                  Average = true,
                  Variance = true,
                  StDev = true,
                  StError = true,
                  DefaultQuantiles = false,
                  Significance = true,
                  Weight = string.Empty,
                  TotalText = "Total",
                  UseAxisName = "true",
               };
         parameter.PercentileList.Clear();
Class Diagram
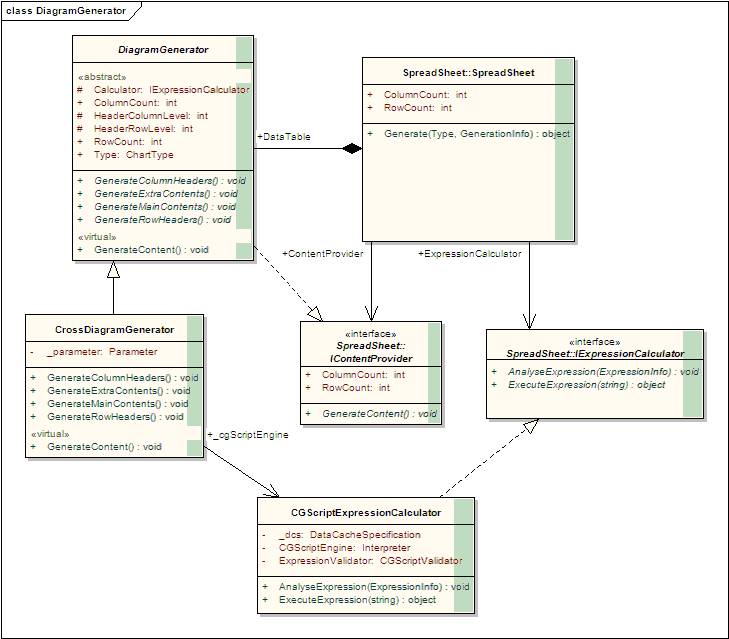
As showing by the diagram, the CrossDiagramGenerator inherit from the generic abstract parent class DiagramGenerator which is actually an implementation of IContentProvider. The class also has reference to CGScriptExpressionCalculator which is an implementation of IExpressionCalculator. So, the class has enough resource to become an input of a SpreadSheet.
And using of the CrossDiagramGenerator is as simple as the below code:
         UltraWebGrid chartControl = new UltraWebGrid("grdResultTable");

         chartControl.DisplayLayout.RowSelectorsDefault = RowSelectors.No;
         chartControl.DisplayLayout.BorderCollapseDefault = BorderCollapse.Separate;
         chartControl.DisplayLayout.ScrollBar = ScrollBar.Never;
         chartControl.DisplayLayout.ReadOnly = ReadOnly.PrintingFriendly;

         DiagramGenerator diagramGenerator = new CrossDiagramGenerator(parameter);

         DataTable data = diagramGenerator.DataTable.Generate<DataTable>(
            new GenerationInfo
            {
               NumberFormat = "0.##"
            });
         if (data.Columns.Count > 0)
         {
            chartControl.DataSource = data;
            chartControl.DataBind();
         }
Document revisions
| Version No. | Date | Changed By | Description |
| 0.1 | 23.02.2009 | } |


