Reports - Templates - Filters - Constants
To see a report you need both a report resource and a report template resource. The report template defines the elements that never change for this report type, where the report holds the extra pieces of information that dedicate it to one specific interest area, or makes sure it suits one specific reader or client!
We have three 'settings' that help support this customization:
- Style sheets: since style sheets can be related to a report, it is possible for us to ensure that different clients have completely different graphical representations of their reports, by giving them all different reports with different style sheets, but pointing to the same template. To read more on style sheets please click here!
- Filters: All reports that use diagrams need to point to a data cache in order to specify from where the get the data. On the report level way can make an additional filter influencing all these diagrams (and something called inline expression, which will be explained later) so that the diagrams for the specific report will only show data that adheres to this general filter.
- Constants: Finally we have an even more advanced filtering possibility than 'Filters' which is called constants. These are specific 'place-holders' that appear inside the template, and before the template is converted to the requested report, we will replace the constant place-holders in the template with the 'replacement values' specified in the report.
Example of the conceptual difference between report templates and reports
Before we start understanding these settings in detail, let us make a simple example of a report using a template.
- We have a template which is a simple text 'Dear [Name], thank you for reading this text'.
- For report A we set [Name]='Peter'; for report B [Name]='Mary'.
- If we then choose to view report A the resulting report will look as follows: 'Dear Peter, thank you for reading this text'.
- For report B the result will be 'Dear Mary, thank you for reading this text'.
Constants
What you see in the above example is actually how Constants work in reports and report templates. We can although not just insert a string like [Name] and it will be replaced. We initially have to declare that this constant exist for this template. Let us quickly look at how that is done.
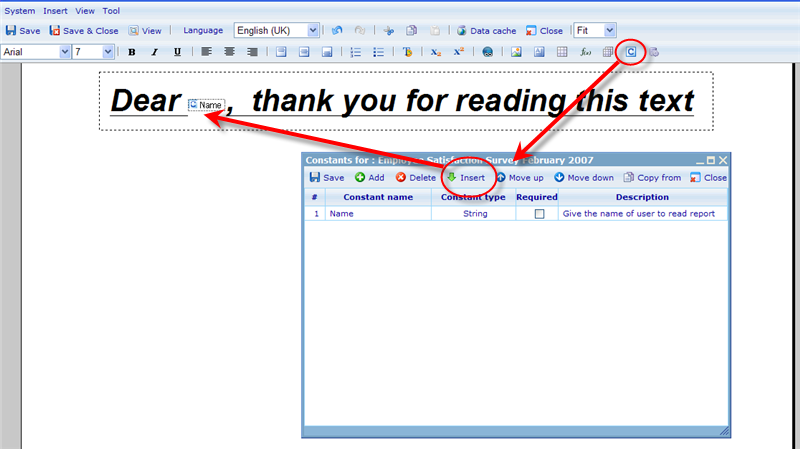
From the two editor setting up templates (which can both be presentation and document types), we can click the 'Constant' button to add constants to the template.
The constants button is the 'c' illustrated below!
Once we click the constants button we can will see the constants management dialog, shown above. From here we can add and delete many types of constants. To learn more on what the different constant features are used for please refer to the help file under Constants for Reports and Questionnaires.
This dialog is also used for inserting the constant place-holder into the text in the template. Above is shown how the place-holder looks when applied.
When we look at any report that is using a template with constants, then an additional tab will appear on the report resource dialog like below:
The only column that will be editable here is the Value column, where you need to insert the value that you want to be replaced with the place-holder when viewing the template.
When viewing the result we will have a text saying 'Dear Mary, thank you for reading this text'.
Affecting diagram data with report filters and constants
Generally we choose to work on one data cache specification (DCS) for one report template. To apply this DCS you must click the Data Cache button you will find in the editor and then choose the applicable DCS from here. Once you have done this all diagrams you add to the report will presume you want to use this DCS for all diagrams you add onwards. It is although possible to choose a different DCS inside the diagram if it needs to differ!
We can add diagrams to a template by clicking the 'Insert diagram' button. This will open the 'spread sheet' editor. To learn how to use the spread sheet editor please click here.
Inside the spread sheet editor in each cell it is also possible to use constants. Let us make a quick example without having to learn in-depth all the more complex elements of spread sheet diagrams.
Let us say we are using the spread sheet to make a pie chart on Gender. The report template we are making is used for 2 reports. One is for France and the other England.
The basic way in a spread sheet to find the number of females versus males is as follows:
| Gender | Total |
| Men | = {count() where gender==1} |
| Women | = {count() where gender==2} |
If we assume that the DCS also has a column called 'Country' then to see the above results for France (given France is identified by 1 in the DCS) would be:
| Total | |
| Men | = {count() where gender==1 && country==1} |
| Women |
= {count() where gender==2 && country==1} |
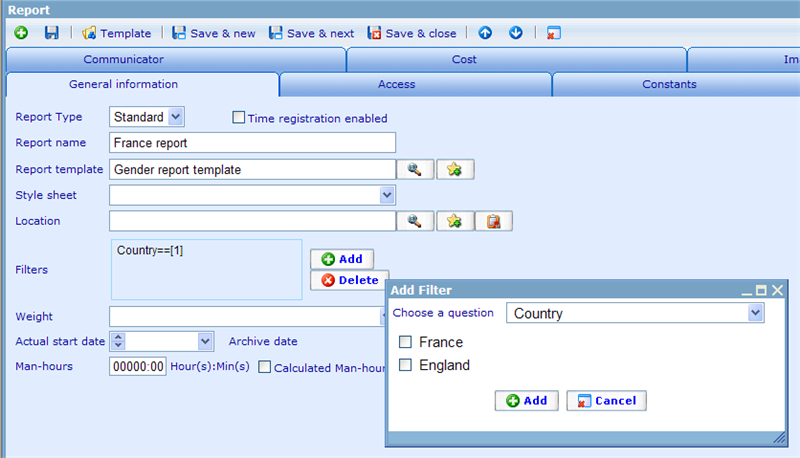
What we do here is add an additional filter on the two expressions to ensure that they both only show the result for France. Instead of making two different report templates for both France and England, we can instead keep the basic expressions without a country filter and then add this filter to the report! Adding a filter to a report would look like below:
When we set a filter on a report like shown above, then all the expressions used on the template will be extended with an additional filter. In above the additional filter would be '&& Country==[1]'. Using filters on reports is a good way to make sure ALL expressions in ALL diagrams show results for one specific main group!
But there may be situations where we do not want all expressions to be influenced by a general filter. Let us imagine a situation where we want to compare the country relevant for the report to an average of all countries. The spread sheet expressions where this country would be:
| Gender | France | All countries |
| Men | = {count() where gender==1 && country==1} | = {count() where gender==1} |
| Women |
= {count() where gender==2 && country==1} |
= {count() where gender==2} |
But if we have to do this for each country that we want to make a report for it would be a lot of work. But we cannot here remove the country filter ´&& country==1' and apply the filter at the report level, since applying filters at report level influences all expressions in the report template - thus also the 'All countries' column.
We do although have an extra option to ensure we can reuse the template for the report for each country. Namely constants! What we can do is add a numeric constant to the template called 'Country' and then use this constant inside the expression.
Let us see how that would work:
| Gender | France | All countries |
| Men | = {count() where gender==1 && country==[countryconstant]} | = {count() where gender==1} |
| Women | = {count() where gender==2 && country==[countryconstant]} | = {count() where gender==2} |
Notice that constants are placed in brackets to make them easy to identify for the system!
Then when we create the report we will go to the constants tab of the report called 'France' and specify that for this report countryconstant=1. When we view the report the constant will be replaced by 1 and thus ensure that we get a customized report where not all expressions are changed.
Inline expressions in reports
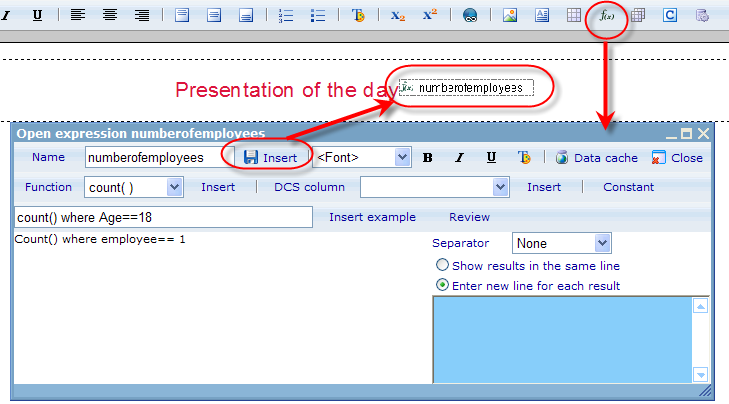
Inside both the presentation and document template editors we can also insert something we call 'Inline expression'. This is very similar to a diagram, except that it provides the results for only one expression, and the result is provided as part of a text area (very much like a constant)!
Typical uses of this is when you wants results of a survey to be part of the text of a report or presentation (and not only in diagram form). Notice that inline expressions are also influenced by filters set at the report level. It is also possible to use constants in filter expressions!
The default data cache that will be used for filter expressions is the one you attached to the report template. But as you will see, it is even possible to choose individual data caches for each filter expression. If you want to see whether or not your expression will return correct data, you can click the 'Review' button to see what will happen. If you inserted constants into the filter expression it will not work from here though, since it will not know which report you believe is holding this constant value.
There is an 'example' feature in the third level tool bar. This is just for helping you construct legal expressions. You can choose the function you want to use in the second level tool bar and then the example line will show how to construct an expression using that function.
If you are extracting an array of results from a data cache (typically answers to text questions) you will need to specify the format in which this array is presented. You can here choose to show it in the same line with separators between each answer, or you can simple add a new line for each result of the array you are showing.
The drop downs you see in the above with values 'count()' and 'Job_satisfaction_SQ_1' are expression creation helpers, which will help you put together expressions in the expression area. The first drop down is specifying the available functions and the second one the available data cache columns. To learn more on how to set then together syntax-wise please click here!


