Significance
In statistics, a result is called statistically significant if it is unlikely to have occurred by chance. "A statistically significant difference" simply means there is statistical evidence that there is a difference; it does not mean the difference is necessarily large, important, or significant in the common meaning of the word.
The significance level in Catglobe is hard-coded to 5%. That means that there is only a 5% chance that data differences between sub filtrations of data happened by chance. In other words, there is a 95% chance that the results seen are significant.
Significance can be applied to be shown on table diagrams from cross diagrams, tabulations and quick reports. Since the latter two enable users to save a report template with the specific diagrams, then we have enabled spreadsheets to show the parameters underlying a significance test directly from a spread sheet editor. These settings are not available when opening spread sheets that were not created from tabulation or quick reports.
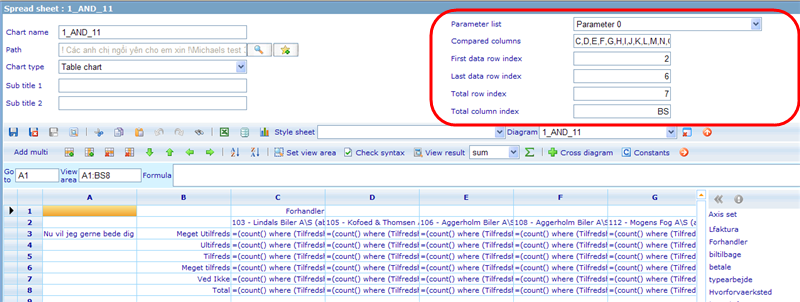
Below is shown an example of a spreadsheet opened with significance parameters.
The significance parameters cannot be edited in this version, but these feature is expected in one of the next versions. The explanation of each of the parameters is specified below:
Parameter list: It is possible to have more than one significance test on a diagram. This normally happens when we have multi-level diagrams where each sub level will have their own significance test compared to other elements in the same sub level quadrant.
Compared columns: Lists all the columns that are compared in the significance test.
First data row index: Lists the first row that the significance test will be performed on.
Last data row index: Lists the last row that the significance test will be performed on.
Total row index: Lists the total number of rows being subjected to the significance test.
Total column index: Lists the column that has information of total number of respondents for each row.
Let us finally look at how significance is shown in a diagram. Notice all the cells that have either [+] or [-] in them. These are the cells that are significantly different that other cells in the same rows.

