Tabulation_setDiagramStyle
Sets the style for part of a chart.
Syntax
Tabulation_setDiagramStyle(styleType, diagramStyle)
or can use TabulationDiagramParameter.SetDiagramStyle(styleType, TabulationDiagramStyle);
Arguments
- styleType: enumeration for the part of a chart you want to set. Below is the full list of chart style type enumerations:
TableDiagram_AllTable
TableDiagram_ColumnHeader
TableDiagram_ColumnHeaderLevel1
TableDiagram_ColumnHeaderLevel2
TableDiagram_ColumnHeaderLevel3
TableDiagram_ColumnHeaderLevel4
TableDiagram_RowHeader
TableDiagram_RowHeaderLevel1
TableDiagram_RowHeaderLevel2
TableDiagram_RowHeaderLevel3
TableDiagram_AnswerRow
TableDiagram_AnswerRowAlternate
TableDiagram_AbsoluteColumn
TableDiagram_AbsoluteColumnHeader
TableDiagram_AbsoluteColumnValue
TableDiagram_PercentageColumn
TableDiagram_PercentageColumnHeader
TableDiagram_PercentageColumnValue
TableDiagram_TotalColumn
TableDiagram_TotalColumnHeader
TableDiagram_TotalColumnValue
TableDiagram_TotalRow
TableDiagram_TotalRowHeader
TableDiagram_TotalRowValue
TableDiagram_VarianceRow
TableDiagram_VarianceRowHeader
TableDiagram_VarianceRowValue
TableDiagram_AverageRow
TableDiagram_AverageRowHeader
TableDiagram_AverageRowValue
TableDiagram_StdDevRow
TableDiagram_StdDevRowHeader
TableDiagram_StdDevRowValue
TableDiagram_StdErrorRow
TableDiagram_StdErrorRowHeader
TableDiagram_StdErrorRowValue
TableDiagram_MedianRow
TableDiagram_MedianRowHeader
TableDiagram_MedianRowValue
TableDiagram_QuantilesRow
TableDiagram_QuantilesRowHeader
TableDiagram_QuantilesRowValue
TableDiagram_PercentileRow
TableDiagram_PercentileRowHeader
TableDiagram_PercentileRowValue
TableDiagram_SignificanceRow
TableDiagram_SignificanceRowHeader
TableDiagram_SignificanceRowValue
TableDiagram_CountAnswerRow
TableDiagram_CountAnswerRowHeader
TableDiagram_CountAnswerRowValue
TableDiagram_TotalRespondentRow
TableDiagram_TotalRespondentRowHeader
TableDiagram_TotalRespondentRowValue
TableDiagram_WeightRow
TableDiagram_WeightRowHeader
TableDiagram_WeightRowValue
TableDiagram_QuestionHeader
TableDiagram_SpacerCell
- diagramStyle: diagram style object want to apply. It is an array with the following constants.
|
Constant |
Type |
Initial/Default value |
Description |
|
OBJECT_TYPE |
Number |
21 |
Enumeration defining the object type. |
|
TABLE_DIAGRAM_STYLE_FILL |
Array |
As set in the object |
Fill style. Background color. |
|
TABLE_DIAGRAM_STYLE_DECIMAL |
Number |
As set in the object |
Decimal place. |
|
TABLE_DIAGRAM_STYLE_FONT |
Array |
As set in the object |
Font. |
|
TABLE_DIAGRAM_STYLE_VALIGN |
String |
As set in the object |
Vertical alignment (allows values "top", "center", or "bottom"). |
|
TABLE_DIAGRAM_STYLE_HALIGN |
String |
As set in the object |
Horizontal alignment (allows values "left", "center", or "right"). |
Return type
Empty
Examples
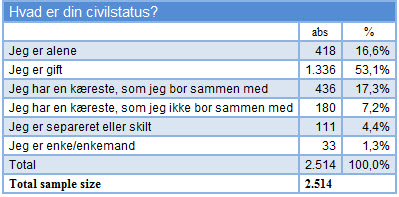
Tabulation_setTableLayout(TableChartLayout_Ifka);
Tabulation_setAbsText("abs");
Tabulation_setPctText("%");
Tabulation_setCountAnswer(true);
Tabulation_setTotalAnswerText("Total sample size");
Tabulation_setEnableOddEvenRowHeader(true);
Tabulation_setMergeStatisticPctItem(true);
//set values for Abs column
array font = {18,"Times New Roman",9,{17,0,0,0},false,false,false,true};
array fill_AbsCol = {19,{17,0,0,0},2,true};
string valign = "center";
string halign_AbsCol = "right";
number decimal = 0;
array diagramStyle_AbsCol={21,fill_AbsCol,decimal,font,valign,halign_AbsCol};
Tabulation_setDiagramStyle(TableDiagram_AbsoluteColumn,diagramStyle_AbsCol);
//set values for Count Answer Row
array font_CountAnswer = {18,"Times New Roman",9,{17,0,0,0},true,false,false,false};
string halign_CountAnswer = "left";
array diagramStyle_CountAnswer ={21,fill_AbsCol,decimal,font_CountAnswer,valign,halign_CountAnswer};
Tabulation_setDiagramStyle(TableDiagram_CountAnswerRow,diagramStyle_CountAnswer);
//set values for Headers column
array font_Header = DiagramFontStyle_getDefault();
font_Header[DIAGRAM_FONT_STYLE_COLOR] = Color_getByRGB("#000000");
font_Header[DIAGRAM_FONT_STYLE_FACE] = "Times New Roman";
font_Header[DIAGRAM_FONT_STYLE_SIZE] = 9 ;
array fill_style = DiagramFillStyle_getDefault();
array style_header = Tabulation_getDefaultDiagramStyle(Diagram_Type_Table);
style_header[TABLE_DIAGRAM_STYLE_FILL] = fill_style;
style_header[TABLE_DIAGRAM_STYLE_FONT] = font_Header;
style_header[TABLE_DIAGRAM_STYLE_VALIGN] = "center";
style_header[TABLE_DIAGRAM_STYLE_HALIGN] = "center";
Tabulation_setDiagramStyle(TableDiagram_ColumnHeaderLevel2, style_header);
Tabulation_setDiagramStyle(TableDiagram_AbsoluteColumnHeader, style_header);
Tabulation_setDiagramStyle(TableDiagram_PercentageColumnHeader, style_header);
createFrequenceDiagram("Civil_status");

Availability
Version 5.8.1
