<accesscontrol>Main:MyGroup</accesscontrol>
The spread sheet editor
When creating spread sheets we are circumventing the CDG object in regards to creating expression sheets. This gives us a lot more flexibility in terms of how we make expressions.
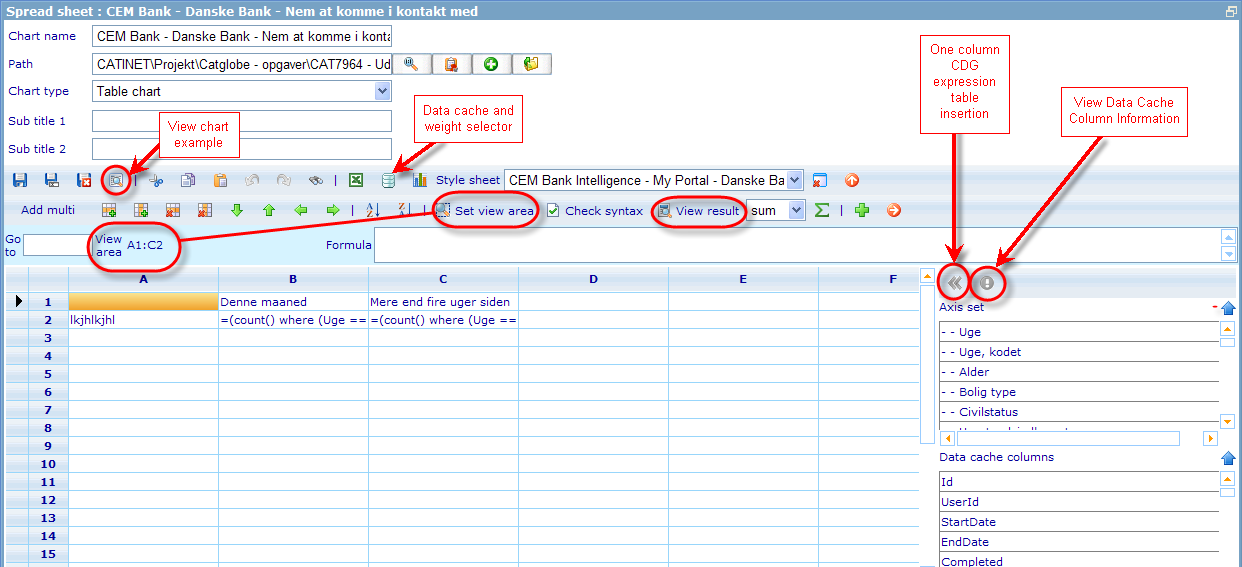
We saw in an earlier chapter how it was possible to use the cross diagram viewer to quickly insert expressions and headers into the spread sheet. Basically the spread sheet editor shows exactly how the expression sheet that gets send to the Expression Conversion Process looks.
Besides using the Cross Diagram Viewer there is an additional tool that also uses the CDG object, namely the “One column CDG expression table insertion”. With this feature you can highlight one column in the Axis set list (directly under the button) and this axis set will be sent to the CDG as column selection (together with data cache choice of course) and will get returned an expression table. This expression table will be inserted into the spread sheet. A lot of the additional parameters of CDG are set to null, false or has a hard-coded value in order for it to work with these limited information.
Next to the above button is the “View data cache column” button that can be used with the list under the Axis set list called Data Cache Column list. Highlighting a data cache column and clicking this will bring up an information dialog. This information dialog should definitely be replaced with the one that data cache offers from the Data Cache editor interface. I think I have a request for this pending in reports request list but please check. Should be a simple operation.
The “View result” button will take the current expression sheet (all regardless of view area) and send it to the Data Table Request (together with needed expressions). This will return a data table that will be shown in the spread sheet in “view mode” user will then have to click “View expression” button to return to the expressions.
A similar button is the “View chart example” button. This will first send the expression sheet to the Data Table Request. The resulting Data Table will be sent to the Chart Request, but only the area that exists in the “view area”. When being sent to a chart request any in-line styles specified for the spread sheet diagram will also be sent as well as if there is any direct external style sheet related to it. The returned chart is shown in a separate dialog that can be closed when finished viewing.
The “view area” specifies which area will be sent to the Chart Request; it does NOT specify what will be sent to the Data Table Request. The reason is that there may be calculations outside the view area which are used in expressions inside the view area.
When saving a spread sheet diagram we thus have a view area and a chart type specified. So already at time of save we can make a validation of whether or not the number of series and items in the view area fits with what is legal for the chosen chart type. Currently the validation is as far as I know done client side and hard coded for each possible chart type, but it should of course be using the Chart Type Object Settings called “Number of series (Integer)” and “Number of items (Integer)”. (Notice setting 16 in chart objects for which types of charts should be available in spread sheets).
Now some of the major things to consider for the spread sheet in connection with refactoring:
- It is very slow. There are lots of spread sheet components around that may be better but big question is if they can replace all the features that exist in the current editor.
- Adding additional columns and rows is a bit cumbersome when user needs to extend work area.
- It would perhaps be an idea to transfer diagram to a resource dialog. Just consider the work process when this is related to diagrams opened from templates (there is a special feature in this case that makes moving between diagrams quick). A considerable advantage would be the moving of the top frame information to another tab together with things like external style sheet choice, data cache and weight choice, removal of save buttons (save with dialog). Include drop down menu for more uncommon actions to make the tool bar less crowded with “hard to recognize” icons.
- Make it possible to set significance parameters from this dialog; not as now only showing them when opening a spreadsheet created from the quick report editor.

