Common properties
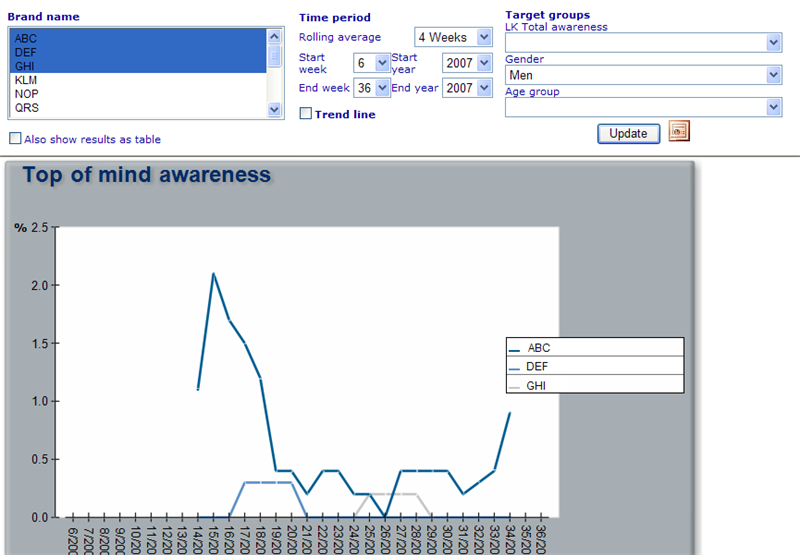
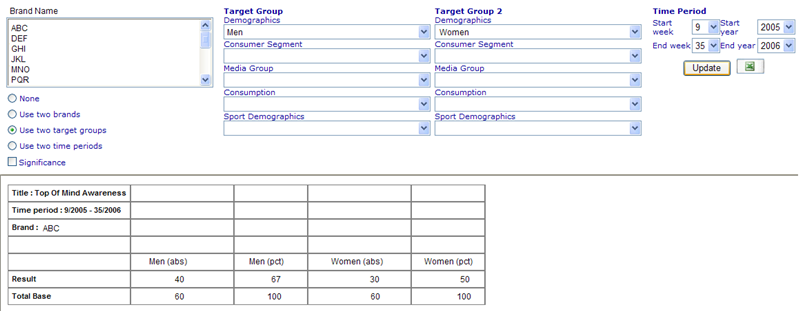
There are three types of diagrams that can use common properties of monitor sites. These are tracking, campaign and comparison diagrams. Let us initially investigate three examples of these diagram types (please look at the bottom of this page to see examples of tracking, comparison and campaign diagrams and their related filter areas).
What you will notice is that they have some things in common, e.g target groups and brand names. You will often have situations where you have 20 diagrams in a monitor site that all share the same target groups, filter controls, free labels and/or time period controls. Instead of having each dynamic diagram we set need to define these controls again, we can have an array of diagrams all inherit their control setting from the same monitor common properties. The usefulness will become especially apparent as clients suddenly decide they want to update dates, target groups, etc, and the administrators need to set these up in multiple places.
A monitor site can have multiple common properties, in case you have arrays of groups of dynamic diagrams in the site which should inherit from slightly different places. Let us look at the common property dialog.
The common property dialog
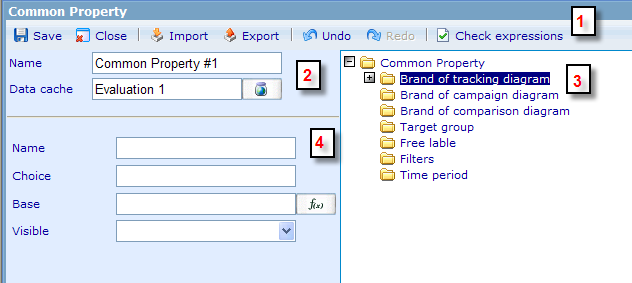
The common property dialog consists of 4 main areas.
1 - Tool bar: You can here carry out actions like save, close dialog, undo and redo. The export feature can generate an XML format of the dynamic diagram settings in a text file. You can then import this XML file to another site using the import button. Finally the check expression field can go through all your expressions that you have set up in the common property file to see if there are any syntax errors.
2 - Required information: You need to give your common properties a name as well as choose a data cache from where data is collected.
3 - Property overview: The folder structure is the way that you see which properties each of your controls have. You can currently see that the 'Brand of tracking diagram' has an expand button (+) on its left side. This means that Brand items have been inserted into the folder.
4 - Detailed property view: Whenever we highlight a node in the property overview area, this area will update to show the detailed specifications of that property. In the above example we see see that the top folder called 'Brand of tracking diagram' is highlighted. The elements that can be set for this level of brand are shown on now in the detailed property view. We will not here explain what the fields in this view mean since they will differ depending on what node you select in the property overview.
To learn more on each of the common property controls that can be set up, please refer to the links below:
Setting up free labels
Examples of dynamic diagrams; Tracking, Comparison, and Campaign
Tracking diagram
Comparison diagram
Campaign diagram
Back to: Common properties


